Curated OER
Water-Is There Going to be Enough?
Students research the availability, usage and demand for water in the local area historically and use projections of the availability, usage and demand for water up to the year 2050. They gather data and present the information in...
Curated OER
Driving Forces Forestry In Canada
Learners discuss the natural and economic impact of forests and forestry. Using given statistics they construct different types of graphs in which they make observations and draw conclusions.
Curated OER
Dimming the Sun
Students collect, interpret and analyze weather variable data. They describe atmospheric variables that affect evaporation. Students create graphs and analyze the information collected.
Curated OER
What is a Cloud
Third graders study clouds and how they are formed. They write acrostic poems about clouds and analyze and graph temperature data collected during varying degrees of cloud cover.
Curated OER
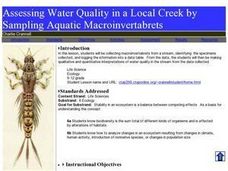
Assessing Water Quality in a Local Creek by Sampling Aquatic Macroinvertabrets
High schoolers experiment collecting macroinvertebrates from a stream and identify the specimens collected and then log in the information into a data table. From the data, they make qualitative and quantitative interpretations of water...
Curated OER
A Tasty Experiment
Students work together to determine if smell is important to being able to recongize food by taste. They try different foods with different textures and hold their nose. They create a graph of their results.
Curated OER
Sea Surface Temperature Trends of the Gulf Stream
Students use authentic satellite data to produce plots and graphs of sea surface temperature as they explore the seasonal changes of the Gulf Stream.
Curated OER
Sea Surface Temperature Trends of the Gulf Stream
Students explore the importance of the Gulf Stream. Using a NASA satellite images, they examine the sea surface temperature. Students collect the temperature at various locations and times. Using spreadsheet technology, they graph the...
Curated OER
Sunspots and Climate
Students make a graph that shows how the number of sunspots has changed over the past 30 years and discover how there is a pattern in sunspot number. They find a disruption in this pattern due to the Little Ice Age.
Curated OER
Stream Chemistry Monitoring
Students become familiar with real-world gathering of chemical data. The experience how the science is done: the nature of analysis, data collection, interpretation, and presentation. They study a nearby body of water for their experiment.
Curated OER
Blowing in the Wind
Students identify and interpret maps, graphs, charts, tables and political cartoons. Students identify what a compass rose is and review its meaning in relation to standard directions. Students design their own weathervanes. Students...
Curated OER
Melting and Freezing of Water
Students differentiate the three states of matter. In this chemistry instructional activity, students analyze graphs of heating and cooling curve of water. They complete a lab report and discuss results.
Curated OER
Weather... Or Not
Learners observe and discuss the local weather patterns, researching cloud types and weather patterns for cities on the same latitude on the Internet. They record the data for 6-8 weeks on a graph, and make weather predictions for their...
Curated OER
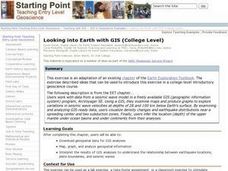
Looking into Earth with GIS
Students work with data from a seismic wave model in a freely available GIS (geographic information system) program, ArcVoyager SE. Using a GIS, they examine maps and produce graphs to explore variations in seismic wave velocities at...
Curated OER
Welcome to Populations!
Students define what population is in their own words. In this biology instructional activity, students explain different ways to measure population density. They interpret population graphs.
Curated OER
Weather Plots
Students investigate the relationship between temperature and humidity. The graphs of weather data gathered and plotted for for an assigned period of time are analyzed and the interpretations shared with the class.
Curated OER
How's the Weather?
Students explore earth science by researching the Internet. In this weather pattern lesson, students utilize the website weather.com to analyze the weather in different geographic locations. Students view charts and graphs based on...
Curated OER
Snow on Sea Ice
Students examine different samples of ice and predict the amount of snow that has fallen in a given year. Using a calculator, they graph the various thicknesses. They analyze the graphs to determine the relationship between the snow and...
Curated OER
Using SWMP Data
Students are introduced to the SWMP system which tracks short-and long-term changes in water. Using this data, they plot and interpret the data on a graph to determine how human activities are lowering the water quality. They also...
Curated OER
When is Dinner Served? Predicting the Spring Phytoplankton Bloom in the Gulf of Maine (College Level)
Students are able to explain the ecological importance of phytoplankton. They describe the components that influence a phytoplankton bloom. Students interpret satellite images in order to correlate buoy data.
Curated OER
The "Coal LIfecycle" Scrapbook
Students discover how coal is formed. In this science lesson, students create a scrapbook on the life cycle of coal and show how coal is formed by showing pictures of each stage.
Curated OER
Rainforest Deforestation and the Water Cycle
Students create terrariums (mini rainforests). They observe and discuss the life processes that occur in their terrariums and how changes in these processes affect the plants and organisms inside. They collect and graph data and present...
Curated OER
Gathering Weather Information
Students watch a video of a recent weather disaster. Using the internet, they work together to examine the weather forecast for tomorrow and next week and discuss why it is important to know the weather. In groups, they use weather...
Curated OER
Bird Beak Buffet
Students complete an activity that allows them to better understand that birds traits are closely related to what they eat, where they live, etc. In this bird trait lesson students complete an activity, create a data board and...


