Curated OER
Aquifer Model
Learners, after researching and brainstorming about aquifers and locating aquifer maps of Texas, participate in the building of a model of an aquifer complete with a pumping station. They also answer a variety of questions at the...
Curated OER
The Great MPA Debate
Students study the 'Marine Protected Areas' process. In this ocean lesson students work in groups, conduct research and present it to the class.
Curated OER
Weather Observation Journal
Students record weather for a period of one month. In this weather lesson, students observe weather for one month on a large pictograph. Students record clouds, wind, temperature and any other weather conditions they observe. Students...
Curated OER
Slow Rot or Not?
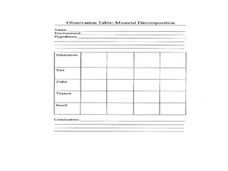
Fifth graders examine how environmental factors affect decomposition. In this decomposition lesson plan, 5th graders experiment with the decomposition of grapes in five different environmental settings. They look at images of items that...
Curated OER
Woodland Animals and Their Habitat
Students explore the natural environment through a video and nature sounds tape. They keep journal's of the unit's activities and vocabulary terms. They play a web of interdependence game and compose a list of forest animals and write...
Curated OER
Volcanic Activity in the U.S.
Young scholars locate and map ten volcanoes in United States, create chart comparing volcanoes by last eruption, type of volcano, location, and interesting fact, and create Powerpoint slide show describing basic
information about...
Curated OER
Guetemala's Changing Forest
Eighth graders compare their local ecological zone to the tropical rainforest. In this natural ecology lesson, 8th graders complete an activity about the differences in ecological zones. They compare their biome to the Guatemalan...
Curated OER
How Trees Contribute to the Water Cycle
In this water cycle instructional activity, 3rd graders conduct an experiment where they observe and calculate how water transpires in different types of trees. Students engage in a class discussion and use Venn Diagrams to compare...
Curated OER
Time Line of Astronomy Events and Discoveries
Students work in groups to present a segment of a timeline of events and discoveries in astronomy. In this astronomy lesson plan, students teach their classmates about their section of the timeline.
Curated OER
DISCOUNT LENSES ( GELATIN WAVE GUIDES)
Students study attributes associated with concept of fiber optics is done using a labmade fiber optic from clear molded gelatin. A variety of shapes can be cut and pieced together to form a conduit to transmit the laser beam by internal...
Curated OER
Activation Energy
Students investigate activation energy through endothermic and exothermic reactions. In this activation energy lesson plan, students conduct 2 experiments, one is an endothermic reaction and the other is an exothermic reaction. Students...
Curated OER
Oil and its Everyday Uses
Explore the properties of oil through an experiment. They use the scientific process to investigate oil, participate in experiments, watch videos,and use information from the internet to determine how oil has changed our...
Curated OER
Creation and Interpretation of Voter Participation Graph
Ninth graders research information about voter participation in the United States based on age. They develop generalizations about voting patterns in the U.S and use Microsoft Excel to analyze the information.
Curated OER
Ozone
Students locate the ozone layer of the atmosphere. They explain natural formation of ozone. They list chemicals that react with ozone. They explain how CFC's destroy ozone.
Curated OER
Ocean Temperatures
Students list data collected by marine buoys and the different kinds of moored buoys. They describe how data is transmitted worldwide. They explain the difference between near shore and offshore air and water temperatures.
Curated OER
Can you Find the Expression
Learners collect data from measurements and weights for this experiment. In this algebra lesson, students analyze graphs they create form their data to find the expression representing the data. They label which graph provided the best...
Curated OER
Linking Algebra to Temperature
Young scholars convert between two units as they calculate the temperature. In this algebra instructional activity, students collect data on seasonal climate and create a graph. They make conjectures based on their data collection.
Curated OER
Trouble in the Troposphere
Students Use data sets from MY NASA DATA to produce graphs comparing monthly and yearly ozone averages of several U.S. cities. They analyze and evaluate the data and predict trends based on the data. In addition, they discuss and...
Curated OER
Earthquake Epicenters and Magnitudes
Pupils work on a virtual earthquake to increase their understanding of seismograms, earthquake epicenters, Richter Magnitude and triangulation when finding the epicenter of an earthquake.
Curated OER
Putting Your Money to Work
Young scholars create a collect data on expenses. In this algebra instructional activity, students create a spreadsheet to solve scientific equations. They incorporate math, science and technology in this instructional activity.
Curated OER
Real World Systems of Linear Equations
Students solve systems of equations with fluency. For this algebra lesson, students graph, use elimination and substitution to solve systems of equations. They identify the point of intersection using algebra.
Curated OER
Water in the Texas Coastal Basins
Students, after researching a Texas coastal basin, map and graph the information they collect and then translate it into a short report to be presented to their classmates. They brainstorm unique ways to maintain Texas estuaries as well...
Curated OER
Earthquakes
Eighth graders demonstrate the mathematical components of a scientific problem as well as illustrate how real world problems can be solved using math. They demonstrate math skills such as rate calculation, graphing, and linear equations.
Curated OER
The Survey Says
Students experience the development of statistical data. In groups, they construct a survey questionnaire for a target audience. Students produce the questionnaire, distribute it, collect it, and tabulate the data. Using EXCEL, the...


