Curated OER
Valentine Candy Count
Young scholars investigate what color Valentine Candy is found more often than any other in a standard bag of "Valentine Conversation Hearts." They sort, classify and graph their findings.
Curated OER
Tune...Um!
Learners collect real data on sound. In this algebra lesson, students use a CBL and graphing calculator to observe the graph created by sound waves. They draw conclusion about the frequency of sound from the graph.
Curated OER
Are you an Energy Saver STAR?
Learners examine how to use energy more efficiently in their own home. They collect data from their home, complete a chart, read a power meter, interpret the data from an electric and gas bill, and create a poster demonstrating how to...
Curated OER
Martian Sun Times
Students become weather reporters for the Martian Sun Times newspaper to gather. interpret, and compare current weather information for Mas and Earth. Final articles be posted on-line. There are seven investigations in this unit.
Curated OER
Using Radiosonde Data From a Weather Balloon Launch
Student use radiosonde data from a weather balloon launch to distinguish the characteristics of the lower atmosphere. They learn the layers of the atmosphere. They graph real atmospheric data.
Curated OER
Great Flathead Lake Ecosystem Mystery
Learners analyze data to solve the mystery of what contributed to an ecological disaster at Great Flathead Lake. They read and graph the available data, create a food web of the problem ecosystem, and construct a formal problem statement...
Curated OER
Why Plants Are Important to Us
First graders explore plant life. In this plant lesson, 1st graders examine various plant life and categorize them. Students graph their data and make journal entries regarding their work.
Curated OER
Weather Report Chart
Students complete a weather report chart after studying weather patterns for a period of time. In this weather report lesson, students measure temperature, precipitation, cloud cover, wind speed, and wind direction for a month. Students...
Curated OER
Inertia
Students conduct an experiment to apply Newton's first law of motion. They observe the inertia of an object in regard to its mass. The students record and graph the outcomes of their investigation and present the relationship between...
Curated OER
Potential and Kinetic Energy
Sixth graders explore potential and kinetic energy. For this science lesson, 6th graders assume the role of a roller coaster engineer and design a roller coaster. Students use their knowledge of kinetic and potential energy to design a...
Curated OER
Marine Protected Areas
Students design a research project about a Marine Protected Area they chose. In this marine biology lesson, students gather fish count and catch data then graph them. They create an information poster about their findings.
Curated OER
Find the Speed of a Protist
Students identify protists under a microscope, and using a stopwatch calculate the speed of a protist from a pond water sample. They use distance and time to identify the speed of a protist, and create a distance versus time graph to...
Curated OER
Building a Pill Bug Palace
Learners make "pets" of isopods (potato bugs) to determine their preferred environment and food sources. They record their results on a bar graph and in a scientific report.
Curated OER
Comparing Temperature, Pressure, and Humidity
Students investigate data on temperature, pressure, and humidity by downloading information from the ARM Website. Working in groups, they discover how weather impacts life in each of the ARM sites. They record weather data in their...
Curated OER
Natural Resources
Fifth graders begin the lesson by identifying the different types of natural resources. As a class, they discuss how environments are destructed and how the loss of one natural resource can affect the economy. Using a map, they label the...
Curated OER
Balsa Wood Airplane Flight and Speed Correlation
Ninth graders calculate the average speed of their balsa wood airplane. In this physics lesson, 9th graders build their own airplane and make necessary modifications to to make it fly straight. They interpret distance and time graph...
Curated OER
How Many Cells Are Born in a Day?
Students predict the number of cells after a series of cell divisions. In this cells lesson students create a graph of their results and create a patterned drawing.
Curated OER
Trouble in the Troposphere
Students create graphs using NASA data, compare ozone levels of several U.S. cities, analyze and evaluate the data and predict trends based on the data, and discuss and describe how human activities have modified Earth's air quality.
Curated OER
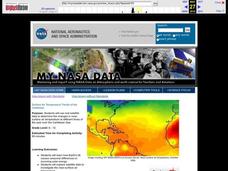
Surface Air Temperature Trends of the Caribbean
Students investigate the seasonal changes to sea surface and near-surface air temperatures near the equator. They use actual satellite data to track and graph the differences in air and sea temperatures during different seasons in the...
Curated OER
Swinging
Students examine and modify a swinging apparatus. They describe the motion of an object by its position, direction of motion, and speed. Students measure motion using a graph.
Curated OER
If You're Under Pressure, Blame It On The Air Force
Young scholars complete an experiment in which they demonstrate that air exerts a force. In groups, they create their own siphon and define air pressure. They estimate the time it might take to siphon various amounts of water. They...
Curated OER
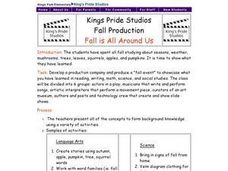
Fall is All Around Us
Pupils develop and create a production company and produce a fall event that demonstrates what they have learned in various subject areas. STudents create stories, complete a venn diagram comparing fall and summer, graph and measure...
Curated OER
Energy Costs of Walking and Running
In this energy learning exercise, students use a data chart comparing the energy used while running and walking to create a graph and complete 2 short answer questions.
Curated OER
Introduction to Topographic Maps
Tenth graders create a topographic map and see how it represents different elevations. In this topographic maps lesson plan students read and interpret topographic maps.
