Inside Mathematics
Squares and Circles
It's all about lines when going around. Pupils graph the relationship between the length of a side of a square and its perimeter. Class members explain the origin in context of the side length and perimeter. They compare the graph to the...
Mathed Up!
Pie Charts
Representing data is as easy as pie. Class members construct pie charts given a frequency table. Individuals then determine the size of the angles needed for each sector and interpret the size of sectors within the context of frequency....
Mt. San Antonio Collage
Quiz 1: Types of Functions
Sometimes the best things are already done for you! Here is a six-problem quiz that has a variety of problems ranging from solving quadratic equations to interpreting a function. The piece-de-resistance is the worked out answer key in...
Curated OER
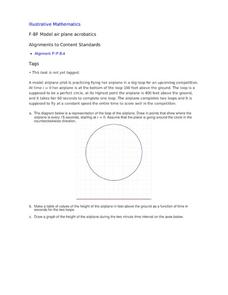
Model Air Plane Acrobatics
Your young airplane enthusiasts will enjoy this collaborative task of graphing an airplane's distance from the ground as it flies in a perfect circle. They will discover that they have graphed a sinusoidal function that comes from the...
Bowland
Fruit Pies
Scholars use formulas for the area of a circle and the area of a rectangle to determine the number of pies a baker can make from a particular area of dough. They must also take into account rolling the remaining dough into a new sheet.
Illustrative Mathematics
Velocity vs. Distance
At the end of this activity, your number crunchers will have a better understanding as to how to describe graphs of velocity versus time and distance versus time. It is easy for learners to misinterpret graphs of velocity, so have them...
CCSS Math Activities
Out of the Swimming Pool
Out of the swimming pool and into the math classroom! Young mathematicians analyze two linear functions representing the number of liters of water in a pool as it drains over time. They must evaluate functions, interpret function...
Curated OER
As the Wheel Turns
This is not your typical Ferris wheel problem. In this exercise, your class will combine their knowledge of sinusoidal functions as well as linear motion to come up with parametric equations that model the position of a point on the edge...
Government of Alberta
Learn Alberta: Math Interactives: Exploring Data Display and Graphs
This multimedia Learn Alberta math resource focuses on graphing data. In the video portion, students will see how math is involved in the display of merchandise in stores. The accompanying interactive component provides an exploration...
Government of Alberta
Learn Alberta: Math Interactives: Exploring Election Data
Using actual Alberta provincial election results, students have the opportunity to interpret election data using a variety of graph types. Pictographs, line graphs, bar graphs, circle graphs, and data tables are covered in this...


