Curated OER
Voter Turnout
High schoolers solve problems using math. They complete a graph, using data from the 2000 presidential election results. Students predict and calculate the outcome of the election based upon the voting patterns.
Curated OER
How Texas is Planning To Manage Its Water
Students research water management strategies in Texas. They analyze projected demand for water in the year 2050, interpret graphs and tables and then discuss the data as part of a written report. They research and map the locations of...
Curated OER
Multiple Representations
Every topic or subject has its own special jargon. Learners work on their math vocabulary as it relates to basic algebra terms. They define and identify function, functional notation, ordered pairs, rate of change, slope,...
Curated OER
Walking Home II
Students explore the relationship between distance and time. They analyze a situation involving distance traveled in a given period of time, represent the situation graphically and algebraically, and discuss the concept of slope as a...
Curated OER
Linear Functions
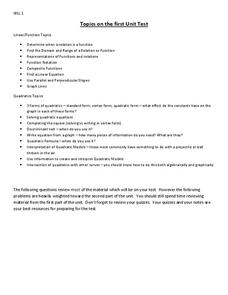
In this algebra worksheet, students identify and label functions as linear or not. They find the domain and range of each function. There are 15 multiple choice questions.
Curated OER
Applying Linear Functions
In this algebra worksheet, students rewrite word problems using algebra and relate linear functions to real life scenarios. There are 2 questions with an answer key.
Curated OER
Oodles of Poodles
Students solve equations by graphing. In this algebra lesson, students differentiate between functions and relations. They use the TI to graph their equation and analyze the graph.
Curated OER
Woody Sine
Students explore the concept of sine. In this sine lesson, students create a sine graph from tooth picks. Students create a unit circle with tooth pick length radius. Students then take the tooth picks from the unit circle and put them...
Curated OER
Venn Diagram and UK Basketball
Students analyze data and make inferences. In this algebra lesson, students collect and analyze data as they apply it to the real world.
Curated OER
What is Log?
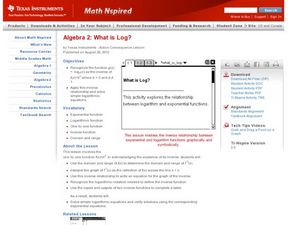
Young mathematicians differentiate between logs and natural logs in this algebra lesson. They solve functions and logarithmic functions. Learners also graph and rewrite the exponential and log functions.
Curated OER
Linear Equations
In this Algebra I/Algebra II worksheet, students write the equation of a line given the coordinates of two points on the line. The one page worksheet contains a combination of three multiple choice and free response...
Curated OER
Function Composition
High schoolers solve two functions at once. In this algebra lesson, students add, subtract, multiply and divide composition functions. They use the correct notation and substitution to get their answer.
Curated OER
Why Would I Owe My Soul to the Company Store?
Sixth graders listen to "Sixteen Tons" by Tennessee Ernie Ford and discuss what it means to owe one's soul to a store. In this mathematics lesson, 6th graders determine what a miner's income was minus his expenses graphing findings in a...
Curated OER
Download and Analyze
Students download information from a NASA website into a database. They transfer it to a spreadsheet by completing the information and analyze the information. They determine temperature averages, mode, and graph the results. They write...
Curated OER
The Apple Orchard Problem
Students explore various approaches to solving a problem of maximizing the total production of apples in an orchard. In this apple orchard lesson, students collect data in order to solve the apple orchard problem presented. Students plot...
Curated OER
Under the Sea - Ocean Mammals/Fish
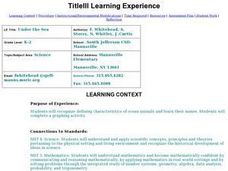
Students explore the similarities and differences between ocean mammals and fish. The characteristics of the life forms observed are placed onto a graph. The classroom becomes the botom of the sea and is explored to gain the required data.
Curated OER
Global Statistics
Students determine statistics based on data. In this statistics lesson plan, students use data and record in charts. Students create graphs based on the statistics found.
Curated OER
Linear Systems and Calories
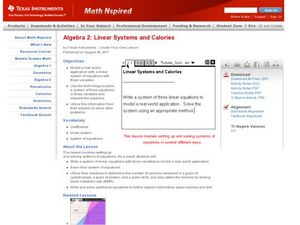
Students define and graph properties of linear equations. For this algebra lesson, students write systems of equations to represent functions. They relate linear equations to the real world.
Curated OER
Pumped Up Gas Prices
Students calculate gas prices. In this transportation lesson, students tally the mileage and gas costs of their car for one months. They figure out how much was spent on gas and create a graph showing average gas prices over time.
Curated OER
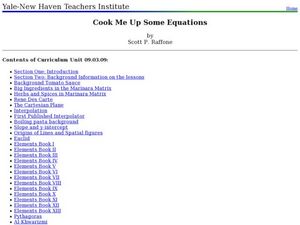
Cook Me Up Some Equations
Young scholars study a variety of math concepts in the context of cooking up a meal. In this math lesson, students calculate surface area and volume. They draw and interpret different types of graphs.
Curated OER
Balancing Equations and Using a Pyramid
Sixth graders complete worksheets and make journal entries to interpret mathematical expressions about the pyramids. In this equality by balancing equations lesson, 6th graders participate in groups or by themselves to complete exercises...
Curated OER
Guess the Age
Students describe graphically, algebraically and verbally real-world phenomena as functions; identify the independent and the dependent variable. They translate among graphic, algebraic, and verbal representations of relations and graph...
Curated OER
Price of Apples- Linear Data
Students collect data and create a graph. In this algebra lesson, students describe functions graphically, algebraically and verbally. They identify functions as being independent and dependent using variables.
Curated OER
Model Data with Quadratic Functions
Students model data using quadratic equations. In this algebra lesson, students simplify and factor quadratic equations. They graph the function using collected data and analyze the parabola.


