Curated OER
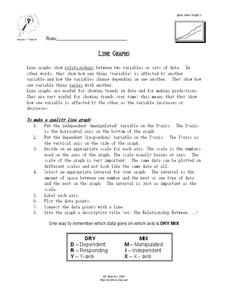
Line Graphs
In this algebra worksheet, young scholars describe the relationship between a line graph and its data. They define the reasons line graphs are used and discuss increasing and decreasing lines. There is one involved questions, requiring...
Curated OER
Energy and Changes of State
Students complete a variety of labs to help them explain how energy affects the changes in states of matter. They also be required to collect and record data, graph data, and apply interpretations of that data.
Curated OER
In A Heartbeat
Learners discuss scatter plots then create a class scatter plot using their heart rate at rest and their heart rate after a few minutes of aerobic exercises. Students copy the points plotted as a class and create individual graphs...
Curated OER
Climbing and Crawling
Students observe and measure plant growth. In this life science lesson, students are introduced to bean and Nasturtium seedlings which they will measure and watch the beans climb (grow tall) while the Nasturtium crawl along the ground....
Curated OER
MVT for Derivatives
Young scholars find the derivative using the mean value theorem in this calculus lesson. They find the slopes of secant and tangent lines, then analyze the function and identify the slope.
Curated OER
Measuring a Mummy Case
Students calculate the size of a mummy case and its contents using ancient Egyptian measurements.
Curated OER
Looking for More Clues
Fifth graders explore how to collect data and display it on a bar and circle graph.
Curated OER
Graphic Designing with Transformed Functions
Teach your class how to transform a graph! By identifying the domain and range of the functions, students can observe the parabola and find the vertex of the transformed graph.
Curated OER
Rover Races
Students identify the challenges encountered by astronauts in operating a planetary rover. In this space science activity, students create a rover using their team members. They follow a command sequence from the driver and navigate...
Curated OER
Wave Math
Students identify the different factors affecting the size and shape of ocean waves. In this math lesson, students calculate wave speed and wavelength given a mathematical formula.
Curated OER
Circuit Training Surprise
Learners move around the gym to music, and when the music stops, they sit on a balloon. Inside each balloon are directions for another physical activity students should do.
Curated OER
A Picture's Worth a Thousand Words
Students analyze the numbers of male vs female administrators and teachers from their school. In this gender equality lesson plan, students use school yearbooks from the 1950's threw present to count how many male vs. female teachers,...
Curated OER
Probabilities for Number Cubes
Students explore the concept of probability. In this probability instructional activity, students roll a six-sided number cube and record the frequency of each outcome. Students graph their data using a frequency chart and...
Curated OER
Graph Logarithms
Mathematicians graph logarithmic equations. Teach your students how to identify the intercepts of logarithmic equations and tell whether the function is increasing or decreasing. They find the domain and range of each function.
Curated OER
What's Your Angle?
Third graders read the story, Magic Schoolbus Inside the Human Body. Then they form right, acute, and obtuse angles using the joints inside their bodies. They write a brief summary about what they learned about angles as a review the...
Curated OER
Fast Food Survey Using Bar Graphs
Second graders create a bar graph to pictorically represent the data collected from a survey of students. They use Excel to electronically create the graphs and data tallies. They then interpret their data using sentences to explain.
Curated OER
What's in the Water?
Students make a water sampler and use proper techniques to collect water.They write a essay explaining the inter-relationship of factors such as temperature, pH, dissolved oxygen, nitrates, and phosphates in a lake that might cause a...
Curated OER
Comparison of Different Methods for Determining Stream Flow at a Stream Site
Students make measurements and calculations to determine the stream flow of an outdoor stream site. In this stream characteristics lesson, students travel to a field site to construct a transect across a stream and measure the...
Curated OER
Hot n' Cold
Students keep a weather log. In this weather and temperature activity, students discuss the information that can be obtained from a map and lead into a discussion about temperature. Students watch a video about temperature and...
Curated OER
The Mathematical Dynamics of Celestial Navigation and Astronavigation
Students explore the different methods used in celestial Navigation and astronavigation. In this math lesson, students construct a sextant and demonstrate how it works.
Curated OER
The Second Fundamental Theorem of Calculus
Students investigate the fundamental theorem of calculus. For this calculus lesson, students derive the fundamental theorem of calculus. They differentiate between the first and second theorem.
Curated OER
Domain and Range 2
How do you identify the domain and range of the function? As learners find out it's as easy as creating a graph. They'll identify the domain and range of a relation from its graph, write symbolic expressions describing the relationship...
Curated OER
Exponential vs. Power
Pupils differentiate between exponential and power functions. They identify the base, exponent and properties of exponential functions. They also graph the functions using the TI calculator.
Other popular searches
- Time Intervals
- Time 5 Minute Intervals
- Tell Time 1 Hour Intervals
- Time Intervals in Math
- Math Time Intervals
- Telling Time Intervals
- Time in 5 Minute Intervals
- One Minute Interval
- Time Intervals Lesson Plans


