Curated OER
Gold Rush California and its Diverse Population
Young scholars compare contemporary cultural differences with historical differences based on population percentage. In this cross-curriculum Gold Rush/math lesson, students analyze aspects of California's Gold Rush population and...
Howard Hughes Medical Institute
Population Dynamics
Will human population growth always be exponential, or will we find a limiting factor we can't avoid? Young scientists learn about both exponential and logistic growth models in various animal populations. They use case studies to...
Curated OER
How Many Penguins Does It Take? Studying Carrying Capacity and Limiting Factors
How does a population's habitat determine the size of that population? Teach learners about carrying capacity and limiting factors with an engaging roleplay activity. Class members pose as a colony of penguins who must gather food amidst...
Curated OER
Water Studies: Precipitation and Population
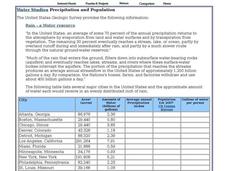
In this water worksheet, students complete the chart about precipitation and population and answer short answer questions. Students complete 14 rows in the chart and answer 4 questions.
Curated OER
Mathemafish Population
It's shark week! In this problem, young mathematically minded marine biologists need to study the fish population by analyzing data over time. The emphasis is on understanding the average rate of change of the population and drawing...
Curated OER
Among the Hidden - Population Math Activity
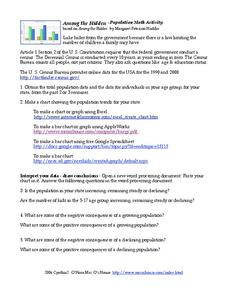
In this population worksheet, students collect data on population by researching the Census Bureau and then make online graphs and answer short answer questions about the data. Students complete 5 problems total.
Curated OER
Math Today - World Population Milestones
Students use the data from USA TODAY Snapshot "World population milestones" to explore and explain the trends in the world population.
Curated OER
In the Wake of Columbus
Young scholars explore how the population decreased in native cultures.
Education World
Putting Turkey on a Table (or a Graph)
Grateful learners put turkey on a table (or a graph)! Through a creative project they show statistical information about turkey population, production, and consumption. A great Thanksgiving lesson that can be applied at any time to the...
Curated OER
Population Models and Qualitative Analysis
In this quantitative analysis worksheet, students explore the limits of a rate equation. They use quantitative analysis methods to determine the differential, plot graphs of their values, and describe the relationships between the...
Curated OER
Go Fish!
Students share a bowl of goldfish crackers. In this lesson on sharing, students see how a limited resource goes furthest when it is evenly shared. Students are allowed to take as many crackers as they would like, and then in contrast,...
Curated OER
Exponential Models
Students fit a constant growth rate exponential model to U.S. population data and use the model to predict future population. They write an equation to determine U.S. population based on constant growth rate model.
Kenan Fellows
Attack of the Aphids!
Insects threaten the food production industry, and aphids are one of the big players! Analyzing data of aphid populations gives insight into their behaviors. Learners model the population data of an uninhibited population with an...
Statistics Education Web
Who Sends the Most Text Messages?
The way you use statistics can tell different stories about the same set of data. Here, learners use sets of data to determine which person sends the most text messages. They use random sampling to collect their data and calculate a...
College Board
Sampling Distributions
The validity of data depends on the strength of the sample. A collection of instruction and activities focuses on sampling distributions and the analysis of that data. Scholars learn about distribution tests such and Central Limit...
Noyce Foundation
Ducklings
The class gets their mean and median all in a row with an assessment task that uses a population of ducklings to work with data displays and measures of central tendency. Pupils create a frequency chart and calculate the mean and median....
Curated OER
Exponential Models
Students fit a continuous change exponential model to U.S. population data and use the model to predict future population.
Curated OER
Two-sided Confidence Interval for a Population Proportion
In this two-sided confidence interval instructional activity, students solve 3 problems to include constructing a confidence interval for a population proportion with a large sample. First, they split the confidence and shad its...
Curated OER
Living on a Fixed Income
Students examine living on a fixed income. For this financial analysis lesson, students discuss living on a fixed income and discuss wants and needs. Students research money saving tips and create a PowerPoint about the topic. Students...
Curated OER
Graphing the Population Explosion of Weeds
Students are introduced to the seed cycle and draw the specific steps. In groups, they identify the human barriers to the spreading of weeds. After calculating the rate of spreading of the Yellowstar Thistle, they create graphs to see a...
Curated OER
Ordering Sets of Two
Place value is important as scholars begin ordering larger number based on their values. They order seven sets of numbers, ranging from three digits to seven digits. Then, they complete a word problem by examining four town populations...
Mathematics Vision Project
Module 4: Linear and Exponential Functions
Sequences and series are traditionally thought of as topics for the pre-calculus or calculus class, when learners are figuring out how to develop limits. But this unit uses patterns and slopes of linear functions in unique ways to bring...
College Board
Special Focus: Inference
Statistics is all about making inferences! A lesson guide explains the meaning of inferences and how to use statistics to make them. The resource provides instruction as well as information about the topic on the AP® Statistics exam.
Curated OER
Home on the Range
Students use maps and mathematics to determine the appropriate panther population in a given area. In this Florida ecology lesson, students research the area requirements of male and female panther and use a map to help calculate how...


