Curated OER
Cricket Weather
In this collecting data learning exercise, 4th graders use the data collected on crickets chirps and the temperature to make a line graph by following 4 directives.
Curated OER
Misleading Graphs
Students explore number relationships by participating in a data collection activity. In this statistics lesson, students participate in a role-play activitiy in which they own a scrap material storefront that must replenish its...
Curated OER
Ornithology and Real World Science
Double click that mouse because you just found an amazing lesson plan! This cross-curricular Ornithology lesson plan incorporates literature, writing, reading informational text, data collection, scientific inquiry, Internet research,...
Curated OER
Animal Runners
In this collecting data worksheet, 4th graders use the data shown on how fast 6 animals can run to create a bar graph. Students follow the instructions on 3 directives for their bar graphs and answer 1 short answer question.
Curated OER
Shaky New Zealand
Students explore geography by answering study questions in class. In this plate tectonics lesson, students identify the earthquake data concerning the country of New Zealand and answer questions regarding the data. Students identify...
Pennsylvania Department of Education
Equal Groups
Students explore statistics by completing a graphing activity. In this data analysis instructional activity, students define a list of mathematical vocabulary terms before unpacking a box of raisins. Students utilize the raisins to plot...
Curated OER
Temperature Line Graphs
In this temperature learning exercise, students create 3 line graphs from data tables showing dates and recorded temperatures. This learning exercise includes an answer key.
Curated OER
"Graph It"
Young scholars work in teams to conduct short surveys of their classmates. They show their results using at least two different types of graphs.
Students separate into teams and are asked that each team to choose something that they are...
Curated OER
Interpreting Medical Data
Students explore human anatomy by graphing scientific data. In this vision lesson, students discuss how ophthalmology works and take their own eye assessment test using the Snellen chart. Students collect vision data from all of their...
Curated OER
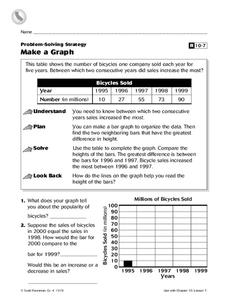
Make a Graph
In this graphs worksheet, 4th graders, after studying and analyzing a table on bicycles sold within several years, answer 2 short answer questions relating to the table.
Curated OER
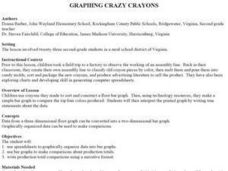
Graphing Grazy Crayons
Children create crazy crayons they made to sort and construct a floor bar graph. Then, using technology resources, they make a simple bar graph to compare the top four colors produced. Students will then interpret the printed graph by...
Curated OER
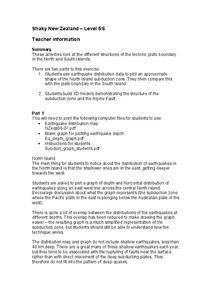
Shaky New Zealand
Students explore Earth science by building a model in class. In this tectonic plate lesson, students identify the impact tectonic shifts have on humans and animals and where the plates and faults lie under New Zealand. Students examine...
Curated OER
Mathematical Models with Applications: The Sounds of Music
Students use an electronic data-collection device to model the sound produced by a guitar string. They identify the graph of a periodic situation and use the graph to determine the period and frequency of sound waves.
Curated OER
Hot and Cold Colors
Students experiment with the color and solar energy absorption. In this color and solar energy absorption lesson, students spend two days discussing and experimenting with the concept of energy absorption. They paint cans with different...
Curated OER
Rolling with Links
First graders explore geometry by completing a worksheet in class. In this non-standard measurement unit lesson, 1st graders discuss different techniques for measuring items without the use of a ruler. Students read several short stories...
Curated OER
Body Language
First graders investigate the three main parts of a plant. In this plant parts instructional activity, 1st graders explore vocabulary for the topic and read a story about plant parts. Students view a PowerPoint and take a quiz for...
Curated OER
Exploring Geometric Figures
Tenth graders explore mathematics by participating in hands-on daily activities. Learners identify a list of different shapes and classify them by shape, size, sides and vertices. They utilize tangrams and geometric pieces to gain...
Curated OER
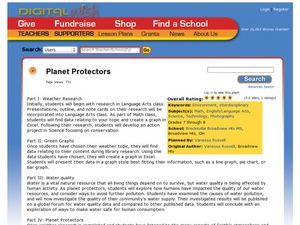
Planet Protectors
Students explore ways to protect the earth. In this environmental issues and technology instructional activity, students investigate the water quality in their community and compare their findings to the water quality in other...
Curated OER
The Great Migration: Pushed By The South, Pulled By The North
Students identify key features of the Great Migration. They explain the concepts of push and pull factors for migration. They create an art project which shows an understanding of the push and pull factors.
Curated OER
We Are Having a Party! Part II
Second graders, in groups, participate in a four-station rotation model to solve problems. They use coins and dice for stations one, two, and three.
Curated OER
The Anti-Gravity Machine
Students examine physics by completing a bicycle experiment in class. In this gravity lesson, students measure the characteristics of different bicycles and compare their different race times. Students utilize a shoebox,...


