Curated OER
Graphing Review
Pupils review the principles of graphing linear functions. They discuss plotting points on a coordinate plane, solving using a table, and then graphing. Students solve problems and determine the slope of the line, y-intercept and if...
Curated OER
CEEnBoT Stories
Students identify the slope of a line as negative, positive, zero or undefined. In this algebra lesson, students identify the distance versus the time using graphs of linear equation. They use the robot and the CEENBoT program to analyze...
Curated OER
Graphs Galore
Fourth graders conduct surveys to collect data. They analyze and interpret the data, then determine which type of graph is appropriate for the data. Students use the data to make predictions, discover patterns and draw conclusions...
Curated OER
Let's Go Slopey
Students create a table of values to graph a line. In this algebra instructional activity, students identify the slope and intercept of a linear equation. They use a Ticalculator to graph their function.
Curated OER
Unit 5 Lesson 01: Graphing on a Number Line
Math masters are introduced to graphing inequalities on a number line. After reviewing inequality symbols, they practice representing them on a worksheet. This simple lesson serves its purpose.
Curated OER
Symmetrical Designs with Pretzels and Marshmallows
Fifth graders create designs that have lines of symmetry using pretzel and marshmallows. In this symmetry design instructional activity, 5th graders work in groups using graph paper, rulers, and toothpicks to plan their own lines of...
Curated OER
Pictures of Data: Post Test
In this data learning exercise, students answer multiple choice questions about charts and graphs. Students answer 10 questions total.
Curated OER
Chapter 2.3 - Slope
In this slope worksheet, students answer 16 slope intercept questions. They determine slopes based on equations, graphs and coordinates. Students also find the equations of lines parallel and perpendicular to a given line and that goes...
Curated OER
Let's Graph It
In this let's graph it worksheet, student interactively answer 10 multiple choice questions about graphing data and types of graphs, then click to check their answers.
Curated OER
Graphing Inequalities
In this graphing inequalities worksheet, students create graphs of algebraic expressions containing inequalities. This two-page worksheet contains explanations and examples prior to the exercise. The first page is a contains...
Curated OER
Means of Growth
Students collect and graph data. In this statistics lesson, students analyze their plotted data using a scatter plot. They identify lines as having positive, negative or no correlation.
Curated OER
Circles Minilab
Learners learn how to measure the diameter and circumference of a circle. In this circle lesson, students organize their data to create a graph. Learners utilize their graph to make an inference about the slope of pi.
Curated OER
Eight Determine the Equation of the Perpendicular Line Problems
In this perpendicular lines worksheet, students determine the equations of perpendicular lines in eight problems. Examples, formulas, explanations, and solutions are provided.
Curated OER
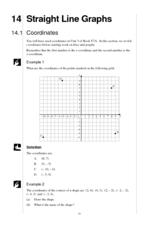
Straight Graph Lines: Coordinates
Young scholars access prior knowledge of coordinates. In this coordinates lesson, students graph coordinate points to create a symmetrical figure and of a straight line. Young scholars complete several practice examples.
Curated OER
Parallels and Distance
In this parallels and distance worksheet, 10th graders solve 8 problems related to parallels of lines and the distance between each line. First, they draw the segment that represents the distance indicated in each figure. Then, students...
Curated OER
Inverse of a Function
In this inverse of function worksheet, 10th graders solve and graph 10 different problems that include graphically represented inverse functions. First, they solve each of the problems involving graphs and their inverses. Then, students...
Curated OER
Local Traffic Survey
Students conduct a traffic survey and interpret their data and use graphs and charts to display their results.
Curated OER
Statistics
In this statistics worksheet, students solve 2 problems that involving plotting data, recognizing ordered pairs, and analyzing the graphed relationship.
Curated OER
Cruising the Internet
Students identify the parts of an engine using a graph. For this statistics lesson, students make a graph from their collected data. They calculate the volume of a cylinder using a line of regression and a scatter plot.
Curated OER
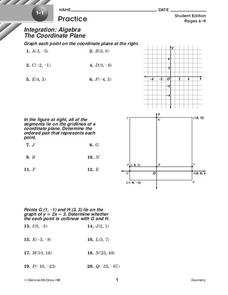
The Coordinate Plane
In this coordinate plane activity, 10th graders solve 20 various types of problems all related to identifying point on a coordinate plane. First, they graph each point on the coordinate plane at the top. Then, students determine the...
Curated OER
Solving Compound Inequalities
In this compound inequalities worksheet, students solve and graph 12 different problems that include compound inequalities. First, they graph the solution of each compound inequality. Then, students write a compound inequality for each...
Curated OER
Getting A Grip On Graphs
Fourth graders gather variety of data and create a graphs to display the data.
Curated OER
Creating and Reading a Pictograph
Second graders examine how data can be transferred into pictures on a pictograph. They analyze data on a graph about chewing gum, and create a pictograph that illustrates data about their preferences for the taste of bubble gum. ...
Other popular searches
- Double Line Graphs
- Graphs. Line Graphs
- Bar and Line Graphs
- Interpreting Line Graphs
- Making Line Graphs
- Reading Line Graphs
- Analyzing Line Graphs
- Creating Line Graphs
- Number Line Graphs
- Reading Double Line Graphs
- Straight Line Graphs
- Bar Graphs Line Graphs


