Curated OER
Linear Equations
In this algebra worksheet, 11th graders solve linear equations and rewrite them in the form y=mx + b. They graph the equations using the slope and y-intercept. There are 22 questions with an answer key.
Curated OER
Graphs
For this graphing worksheet, 9th graders read one page of graphing examples and complete 8 exercise problems. Each problem involves graphing and coordinates.
Rice University
Elementary Algebra
Find all the Algebra 1 content in one location. A helpful eBook contains the content typically found in an Algebra 1 course. Concepts range from solving and graphing linear equations to solving and graphing quadratic equations....
EngageNY
Graphs of Linear Functions and Rate of Change
Discover an important property of linear functions. Learners use the slope formula to calculate the rates of change of linear functions. They find that linear functions have constant rates of change and use this property to determine if...
Curated OER
Stars and Slopes
More of a math lesson than physics or space science, high schoolers take a set of data and plot it on a log-log coordinate system. The write-up for day two was never completed, but day one, "Stars and Slopes," is complex and cohesive....
EngageNY
The Line Joining Two Distinct Points of the Graph y=mx+b Has Slope m
Investigate the relationship between the slope-intercept form and the slope of the graph. The lesson plan leads an investigation of the slope-intercept equation of a line and its slope. Pupils realize the slope is the same as the...
Curated OER
Interpreting Graphs
Sixth graders interpret linear and nonlinear graphs. They create graphs based on a problem set. Next, they represent quantitive relationships on a graph and write a story related to graphing.
Rice University
College Algebra
Is there more to college algebra than this? Even though the eBook is designed for a college algebra course, there are several topics that align to Algebra II or Pre-calculus courses. Topics begin with linear equation and inequalities,...
Curated OER
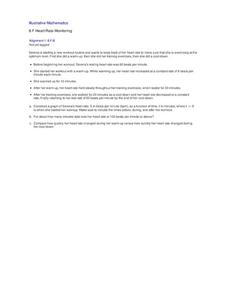
Heart Rate Monitoring
Algebra learners like this resource because it is easy to understand and it relates to their lives. Whether you are starting a new workout routine, or just climbing the stairs, your heart rate increases and decreases throughout the day....
CK-12 Foundation
Intercepts and the Cover-Up Method: The Hidden Zeros
There's no need to cover up this resource — it's good one! Pupils use a slider interactive that covers up parts of the standard form of a linear equation and simultaneously reveals one of the intercepts of the graph. This lets them see...
Virginia Department of Education
Solving and Graphing Inequalities
You can't go wrong with a lesson plan that involves candy! Learners solve and graph one-variable inequalities and use candy to graph the solution. Individuals associate open circle graphs with life savers and closed circle graphs with...
Curated OER
Masters Level B: 5.4 The Slope-Intercept Form
In this slope-intercept form, students identify the x- and y-intercept form of a line. They graph equations using the slope and y-intercept. Students write the equation of a line that contains a pair of points. This one-page worksheet...
EngageNY
Solution Sets to Simultaneous Equations (part 1)
How are systems related? Build on your pupils' previous knowledge of solving systems of equations by introducing systems of inequalities. Learners explore similarities between systems of equations and inequalities to make a strong...
SHS Algebra
Linear vs. Exponential Functions Tasks
Your algebra learners will enjoy the real-life application of the three tasks presented here. They complete a table and a graph comparing the two options presented. One option is linear, while the other is exponential. After coming up...
CK-12 Foundation
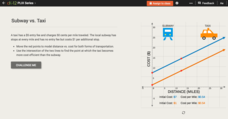
Problem-Solving Models: Subway vs. Taxi
Ride to success in understanding systems of equations. Scholars graph a system of equations on the cost of a subway and a taxi using an interactive. Using this graph allows users to answer some questions about the situation.
Radford University
The Game of Life … Mathematics Style
Make life more organized using mathematics. Scholars get a good look at budgeting and personal finance by using linear equations. They research salary information and costs to develop mathematical models, including equations and graphs.
Charleston School District
Solving Systems with Substitutions
How many large and small watermelons did he sell? Just use the given information to write and solve a system of equations! The two videos accompanying the lesson explain the substitution method and then introduce problem solving. The...
Math Drills
Thanksgiving Cartesian Art: Pumpkin
Not a Halloween jack-o-lantern, but a Thanksgiving pumpkin! Young mathematicians graph and connect points on a coordinate system to unveil the mystery picture.
Curated OER
Linear Equations
In this linear equations worksheet, students problem solve two equations by graphing the solution set of the system in each one.
Illustrative Mathematics
How Many Solutions?
Determining the number of solutions is an important stepping stone to higher math. In this case, the resource asks algebra pupils to find a second linear equation for a certain solution of a system. When one is asked for a linear...
Illustrative Mathematics
Downhill
A car traveling down a steep hill is the model for this resource. The confusion comes when the elevation, E, is given in terms of distance, d. The distance, d, is the horizontal distance from E. Therefore, the equation, E = 7500 – 250d,...
Curated OER
Systems of Equations
Pupils solve inequalities and systems of equations. For this algebra lesson, students use substitution and elimination as they solve algebraic systems. They use graphing and a table to support their solutions.
Alabama Learning Exchange
Graphing Stations
Students explore the concept of graphing stations. For this graphing stations lesson, students head to various teacher set-up stations involving slope, point-slope, standard form, parallel lines, etc. Students work problems...
Curated OER
Linear Inequalities
Students imagine that they own a sneaker company. They are asked how they would know if their company made a profit. Students determine the number of sneakers of each type they need to sell in order to "break even." They are asked how...
Other popular searches
- Graphing Linear Equations
- Graphing Lines
- Graphing Linear Systems
- Graphing a Linear Equation
- Algebra Graphing Lines
- Graphing Lines Quilt Pattern
- Graphing Nonlinear Equations
- Pre Algebra Graphing Lines
- Graphing. Linear Equation
- Area Graphing Lines
- Ged Graphing Lines
