Curated OER
Parent Functions Review Sheet
No laundry or cooking dinner here: these parent functions are all about math. Every graph you could think of from basic linear functions to the hyperbolic arccotangent function are included. With 40 parent functions, the worksheet...
Lane Community College
Review Sheets: Beginning Algebra
This jumbo worksheet contains everything you need to get through Pre-Algebra. Begin with simple expressions, and end with linear functions and polygons. There are multiple problems for each topic to make sure those skills are set.
Curated OER
Generating Points and Graphing
Students create a table of values to help them plot. In this algebra activity, students plot their points on a coordinate plane creating a graph. They observe and analyze linear functions.
Curated OER
Linear Graphs and Equations
In this linear graphs and equations worksheet, students examine points on a graph and identify coordinates plotted on the point. Students determine the slope of a line and write the equation of a line. This three-page worksheet contains...
Curated OER
Graphing Functions
In this graphing functions worksheet, 10th graders solve 10 different problems that illustrate various graphs of functions. They determine the type of function that each graph shows. Then, students write the equation for the line graphed...
Curated OER
Graphing 3 Ways
In this graphing worksheet, students graph 10 equations using the following methods: slope-intercept form, x- and y-intercepts, or by using a table. Students check their work using a graphing calculator.
Curated OER
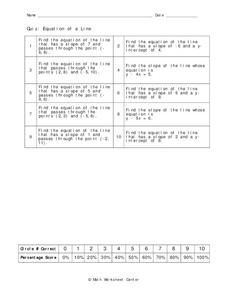
Equation of a Line
In this equation of a line activity, 9th graders solve 10 different problems that include the equation of a line. First, they determine the equation of a line that has a given slope and passes through a given point on a graph. Then,...
Curated OER
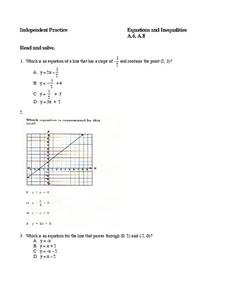
Equations and Inequalities
In this equations and inequalities worksheet, 9th graders solve and complete 10 different multiple choice problems. First, they determine the equation of a line that has a given slope and contains a point. Then, students determine the...
Curated OER
How Many Solutions to the System?
Solve systems of equation using graphing! In this algebra lesson, learners use the TI to graph two lines and identify the number of solutions. They perform interactive graphing on the navigator.
Curated OER
Equations Lesson Plan
Seventh graders play "What's my Rule" beginning with simple equations and working towards harder problems as student's gain confidence. They evaluate the equations by graphing them. Students identify the slope and y intercepts of the...
Curated OER
Stories to Graphs
Students graph their solutions using a linear equation. In this algebra lesson, students rewrite words problems into algebraic equations and graph their solutions. They solve word problems dealing with real lie scenario.
Curated OER
Solving Equations as Word Problems
Students solve linear equations using word problems. In this algebra lesson, students rewrite the word problems by identifying the important information. They make a table and graph their results to analyze it.
Curated OER
Solving Systems of Equations by graphing for Algebra One
Students watch the teacher demonstrate on an overhead projector how to graph various equations before the students try them on their own. They start with pencil and paper; once they grasp the concept they move on to punching in the...
Curated OER
How Many Frogs?
Students explore the concept of linear regression. In this linear regression activity, students find the line of best fit for a set of data pertaining to a frog population. Students use their line of best fit to predict the frog...
Curated OER
Graphing Inequalities in Two Variables
This study guide is a great resource to help you present the steps to graphing linear inequalities. Show your class two different ways to graph an inequality and work on a real-world example together. The document could also be easily...
PBL Pathways
College Costs
Predict the year that college costs will double in your state using linear modeling. The first part of this two-part project based learning activity asks young mathematicians to use data from the College Board. They graph the data,...
West Contra Costa Unified School District
Discovering Slope of a Line in Standard Form
From start to finish this skills practice resource provides a way for individuals to explore the standard form equation of a line. Begin with a warm-up, work through the problems, and then discover the relationship between the...
Curated OER
The Barbie Bungee Drop
What do math, bungee jumping, and Barbie® have in common? Young adventure seekers use rubber bands as bungee cords to predict a thrilling, but safe, jump for their doll. First, test jumps are conducted with a few rubber bands. Then more...
Willow Tree
Approximating a Line of Best Fit
You may be able to see patterns visually, but mathematics quantifies them. Here learners find correlation in scatterplots and write equations to represent that relationship. They fit a line to the data, find two points on the line, and...
Curated OER
Another Way of Factoring
Focusing on this algebra instructional activity, learners relate quadratic equations in factored form to their solutions and their graph from a number of different aspects. In some problems, one starts with the original equation and...
Curated OER
Do Two Points Always Determine an Exponential Function?
Algebra learners explore, analyze and build an exponential equation given its form and a specific point that exists on the function in this task. The last question asks learners to apply their ideas to an exponential equation given two...
Charleston School District
Solving Systems by Inspection
Can you solve a system by just looking at it? The previous lessons in the series taught three methods of solving systems of equations. Now learners discover they can determine the number of solutions of a system just by looking at it....
Curated OER
Explore Learning Exponential Functions
High schoolers graph exponential equations and solve application problems using exponential functions. They re-enact a story about a peasant worker whose payment for services is rice grains doubled on a checker board. They place M &...
Radford University
A Little Devil In Need of Help
Math modeling to help endangered species? Scholars first investigate linear and exponential equations and graphs that model fictitious animal populations. They consider how key features of the graphs relate to the situation. As a final...
Other popular searches
- Graphing Linear Equations
- Graphing Lines
- Graphing Linear Systems
- Graphing a Linear Equation
- Algebra Graphing Lines
- Graphing Lines Quilt Pattern
- Graphing Nonlinear Equations
- Pre Algebra Graphing Lines
- Graphing. Linear Equation
- Area Graphing Lines
- Ged Graphing Lines


