Hi, what do you want to do?
Texas Instruments
Texas Instruments: Solving a System of Linear Equations
In this activity, students' will collect and analyze motion data in order to determine the solution to a linear system of equations. They graph two motions on a common axis and find their intersection.
Texas Instruments
Texas Instruments: Fitting an Equation to Bivariate Data
In this activity, students fit a linear least-square regression line to population data. They explore various functions to model the given data.
Texas Education Agency
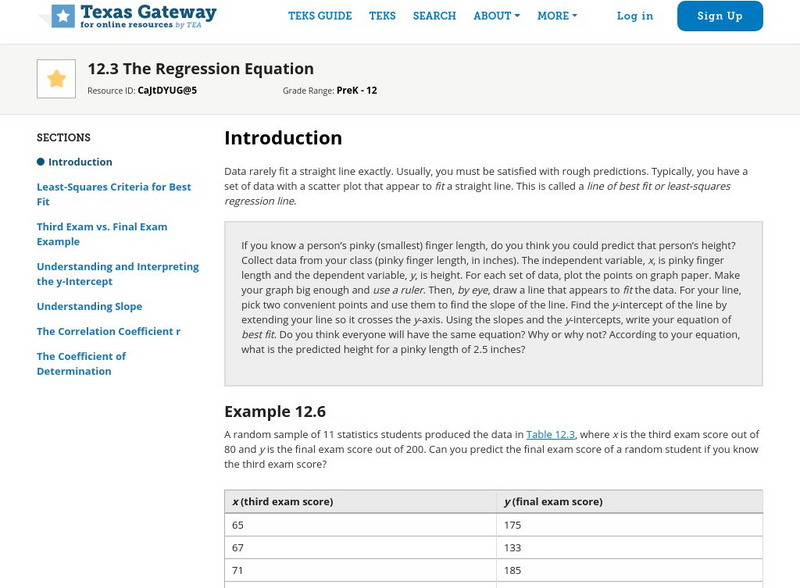
Texas Gateway: Tea Statistics: The Regression Equation
A tutorial on how to find the line of best fit or least-squares regression line for a set of data in a scatter plot using different methods and calculations.
Khan Academy
Khan Academy: Estimating Equations of Lines of Best Fit and Making Predictions
Practice estimating the equation of a line of best fit through data points in a scatter plot. Then use the equation to make a prediction. Students receive immediate feedback and have the opportunity to try questions repeatedly, watch a...
Varsity Tutors
Varsity Tutors: Hotmath: Algebra Review: Fitting Linear Equations to Data
Find a quick, concise explanation of how to use data to find the linear equation for it. An example is given and clearly explained.
TeachEngineering
Teach Engineering: Walk the Line: A Module on Linear Functions
This module leads students through the process of graphing data and finding a line of best fit while exploring the characteristics of linear equations in algebraic and graphic formats. Then, these topics are connected to real-world...
Texas Instruments
Texas Instruments: Finding Linear Models
Students graph a scatter plot, find average rate of change, develop a linear model, find a linear regression and a median/median line for a set of data graphed in a scatter plot and predict profit.
Texas Instruments
Texas Instruments: The Linear Force Relation for a Rubber Band
In this activity, students' will use a force sensor and a motion detector to study the relationship between the force applied to a rubber band and the distance to which it stretches. They will then model force versus strech data with a...
Varsity Tutors
Varsity Tutors: Hotmath: Practice Problems: Fitting Equations to Data
Five problems present practice using data to write equations and linear models. They are given with each step to the solution cleverly revealed one at a time. You can work each step of the problem then click the "View Solution" button to...
Cuemath
Cuemath: Linear Graph
A comprehensive guide for learning all about linear graphs with definitions, properties, their equations, how to plot or analyze them, solved examples, and practice questions.
University of South Florida
Fcat: Bungee M&m's: Teacher Notes
Students will learn how to draw a line of best fit for a set of data using m&m's and a "Bungee."
University of South Florida
Fcat: Shaq's Hand/foot Span: Teacher Notes
Students compare their own hand/foot span to Shaquille O'Neal's, then graph the data & construct a best-fit line. They can then use the information to investigate the proportionality of the human body.
ClassFlow
Class Flow: Fitting Models to Data
[Free Registration/Login Required] A basic premise of science is that much of the physical world can be described mathematically and many physical phenomena are predictable. This scientific outlook took place in Europe during the late...
University of South Florida
Florida Center for Instructional Tech: Wacky Water World
At this site investigate linear equations with a graphing calculator. Data is gathered from a hypothetical situation of purchasing tickets at a waterpark.
Texas Instruments
Texas Instruments: Linear Relationship Between Weight and Quality
Students use a Force Sensor to collect weight versus number data for a collection of identical pennies and model the data using a linear equation. They will then interpret the slope as it relates to independent and dependent variables.
University of South Florida
Florida Center for Instructional Tech: Famous People
Students estimate the ages of famous people, then create a scatterplot with the actual ages. This activity allows them to estimate with linear equations. You can access the age data through the "activity" link.
Texas Instruments
Texas Instruments: Ball Toss Activity
Students receive data from tossing a ball into the air. They are to graph it, set a window, and analyze the height, how long it was in the air, etc. They then find an equation that models the data.
CK-12 Foundation
Ck 12: Introduction to Matrices: Matrices to Represent Data
[Free Registration/Login may be required to access all resource tools.] This lesson defines, organizes, and compares matrices. Includes examples, video, and review problems.
Texas Instruments
Texas Instruments: Graphing Your Motion With Easy Data App and Cbr 2
Students can use a CBR 2 motion detector to measure distance and velocity. Students prepare graphs of motion and analyze them. They compare and match graphs of distance versus time and velocity versus time.
Texas Instruments
Texas Instruments: An Exploration of Direct Variation and Linear Regression
Students will use this activity for the following Algebra concepts: Review of Direct Variation; Properties of direct variations; Finding the constant of variations from data sets; Find missing values in data sets both numerically and...
Texas Instruments
Texas Instruments: What Is a Linear Regression?
In this activity, students create lists of data points, plot them on a graph, and determine the regression equation of the best fitting line. They also understand exactly how the linear regression is determined.
Texas Instruments
Texas Instruments: Step by Step Activity Data Collection & Analysis
In this activity, students create a situation that produces linear behavior by stepping heel to toe and taking distance readings as each step is taken. Students then apply the properties of a linear function to develop a model for motion.
CK-12 Foundation
Ck 12: Scatter Plots and Linear Correlation
[Free Registration/Login may be required to access all resource tools.] This lesson covers plotting a scatterplot and finding a linear equation that best fits the data.
CK-12 Foundation
Ck 12: Algebra: Determining the Equation of a Line
This comprehensive study guide highlights the main terms and formulas needed to determine the equation of a line. Examples are included.


