Curated OER
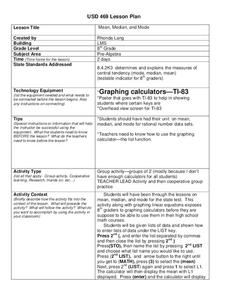
Mean, Median, and Mode
Eighth graders practice using the LIST key on graphing calculators using the proper syntax. They work with the functions of mean, median, and mode in a teacher led lesson and then with a partner on a second data set. They follow...
Curated OER
Power, Work and the Waterwheel
Students use a two-liter bottle, dowel rod and index cards to design and construct a water wheel. They then calculate the power created and measure the work done by the water wheel in Watts and Joules.
Curated OER
Polygonal Strings
Sixth graders apply knowledge of how to calculate the area and perimeter of triangles. They determine why it is inappropriate to measure the area of land by its perimeter which is done in certain areas of New Guinea. They complete a...
EngageNY
The Height and Co-Height Functions of a Ferris Wheel
Show learners the power of mathematics as they model real-life designs. Pupils graph a periodic function by comparing the degree of rotation to the height of a ferris wheel.
EngageNY
Determining the Equation of a Line Fit to Data
What makes a good best-fit line? In the 10th part of a 16-part module, scholars learn how to analyze trend lines to choose the best fit, and to write equations for best-fit lines to make predictions.
Curated OER
Changes in the Copper Penny
Third graders explore the difference between a physical change in a substance and a chemical change. students study the volume, density, altering shape and chemistry of a copper penny.
Curated OER
Math: a World of Symmetry
Students expand their knowledge of quadrilaterals and identify basic symmetrical forms. Over three weeks, they explore the math, application, and discussion of symmetry. After conducting Internet research, students create symmetrical...
Curated OER
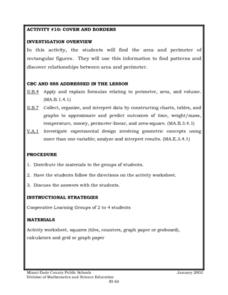
Cover and Boarders
Students find the area and perimeter of rectangular figures. They use this information to find patterns and discover relationships between area and perimeter. Students apply and explain formulas relating to perimeter, area, and volume.
Curated OER
Reading Graphs
Students practice plotting functions on the Cartesian coordinate plane, see several categories of functions, including lines and parabolas, and read a graph, answering questions about the situation described by the graph
Curated OER
Reading Graphs
Students plot functions on the Cartesian coordinate plane. They explore lines and parabolas. Students analyze graphs and answer questions about the information presented on the graph using an online program.
Curated OER
PLANETS IN PROPORTION
Students discover scales for both the solar bodies' relative sizes and their distances from the sun. They find equatorial circumference and volumes of their solar bodies. Students apply estimation strategies and proportioanl reasoning to...
Curated OER
Graphing and the Coordinate Plane
Students gain practice reading coordinates and plotting points by participating in the Coordinates! Game. They demonstrate and test their skills with graph paper and the Maze Game.
Curated OER
Saving Money Through Mathematics
Third graders discuss light sources and collect data about energy sources. They compare data and create a multiple line graph showing energy used by light sources for each student in the group. They present their graphs and write a...
American Statistical Association
Scatter It! (Predict Billy’s Height)
How do doctors predict a child's future height? Scholars use one case study to determine the height of a child two years into the future. They graph the given data, determine the line of best fit, and use that to estimate the height in...
Curated OER
Busted Bubbles
Using the scientific method, and bubble gum, learners conduct a motivating experiment. After conducting a series of tests involving bubble gum, they graph and analyze their results. This is the type of activity everyone loves.
American Statistical Association
Scatter It! (Using Census Results to Help Predict Melissa’s Height)
Pupils use the provided census data to guess the future height of a child. They organize and plot the data, solve for the line of best fit, and determine the likely height and range for a specific age.
American Statistical Association
How Tall and How Many?
Is there a relationship between height and the number of siblings? Classmates collect data on their heights and numbers of brothers and sisters. They apply statistical methods to determine if such a relationship exists.
Curated OER
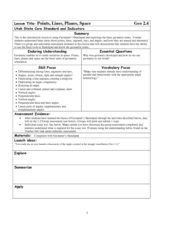
Points, Lines, Planes, and Space
In this points, lines, planes, and space worksheet, students solve word problems dealing with points, lines, planes, and space. Students complete 20 individual problems and 20 group problems.
Curated OER
Viewing Tubes
Middle schoolers complete a lab in order to discover if the length of a viewing tube, its diameter, or the distance from an object affect the type of data collected and the resulting graph.
Curated OER
The Gum Drop
Students find the area of three figure by the traditional formulaic methods. Then they count the number of grid squares to double check. They show an intuitive sense of Pick's Algorithm by counting every two boundary squares as one unit....
Curated OER
Graphs and Functions
Pupils are introduced to plotting functions on the Cartesian coordinate plane seen several categories of functions, including lines and parabolas
Curated OER
Topic: Math, Chemistry, and Food
Learners listen as the teacher tells the story of Sisyphus rolling the stone up the mountain. Students prepare two batches of jello, one with fresh pineapple, and one with canned pineapple. While the jello is setting, learners work on...
Curated OER
Ohm's Law
Students explain the meaning of Ohm's Law, and plot a graph of voltage versus current, by explaining how the slope is the resistance of the circuit.
Curated OER
Perimeters, Patterns, and Conjectures
Students discover patterns and write conjectures relating to perimeters and polygons. Working in cooperative learning groups, they use manipulatives and graphic organizers to solve problems then answer a series of questions in which they...
