Curated OER
Patterns and Algebra - Modeling
Seventh grade math is so much fun! They solve 10 different problems that include using patterns to complete a table, describe the pattern, and identify the specific term in the pattern for each. Then they give a description of the...
Concord Consortium
Bill the Ball Bearing Man
Just how durable could a hollow ball bearing be? Learners model the strength of the walls of a ball bearing as a function of the radius of its cavity. They use their models to make reasonable conclusions about the probability of failure...
Curated OER
Modeling Population Growth
High schoolers create linear, exponential, and quadratic models of U.S. population data to determine which function best represents U.S. population growth. They predict future populations based on each model.
EngageNY
Graphs of Quadratic Functions
How high is too high for a belly flop? Learners analyze data to model the world record belly flop using a quadratic equation. They create a graph and analyze the key features and apply them to the context of the video.
Curated OER
More Complicated Functions: Introduction to Linear Functions
Students explore the concept of linear functions. For this linear functions lesson, students translate linear functions from tables to graphs to equations. Students use an applet to write a function rule for a linear function in...
Curated OER
Introduction to Linear Functions
Students are introduced to the basic ideas needed for understanding linear functions.
Curated OER
Introduction to Linear Functions
Students are introduced to the concept of linear functions. Using new terminology, they describe linear functions in sentences and in data tables. Using the internet, they calculate and record answers to problems which are discussed...
Curated OER
Linear Patterns in Data
Eighth graders extend their learning of graphing linear equations and are introduced to connecting patterns in tables and graphs to represent algebraic representations. They then determine patterns and extrapolate information from these...
Curated OER
Lesson Plan 2: Linear Inequalities
Students investigate linear inequalities and the associated symbols. After a teacher demonstration, they translate given phrases into symbols. Students solve and graph solutions to linear inequalities. Using newspapers, they locate...
Curated OER
Standard Linear Form
Ninth graders identify and describe the x-intercept as the place where the line crosses the x-axis as it applies to football. They create their own differentiations to reinforce the distinction between the x-intercept and the...
Curated OER
Solving, Writing, and Graphing Linear Inequalities
In this linear inequalities worksheet, students solve inequalities, write inequalities in interval notation, and graph inequalities. Students also solve four word problems by writing and solving linear inequalities.
Curated OER
Graphing Linear Equations
Students graph linear equations. In this algebra lesson, students investigate the price of tolls in different states and create a graph. They analyze their graph and draw conclusions.
Curated OER
Sloping and Intersecting a Linear Function
Pupils examine and discuss typical linear equations, and the difference between a linear and nonlinear equation. They observe examples of linear equations and complete a worksheet.
Curated OER
Linear Functions-Learn Your Lines
Students solve and graph linear equations. In this algebra instructional activity, students collect and plot data on a coordinate plane. They use the CBL and TI calculator to graph systems of equation.
Curated OER
Linear and Non-Linear Equations
Students study linear and non-linear equations. After a teacher demonstration, they use calculators to solve and graph equations. They distinguish the difference between linear and non-linear equations.
Curated OER
Exploring Linear Equations
Third graders use graphing calculators to graph equations. They make visual models of algebraic expressions and they can readily see that an equation represents something.
Curated OER
What's My Rule? Simple Linear Functions
Students investigate simple linear functions by trying to guess a function rule from inputs and outputs. They write the function rule in algebraic form.
Curated OER
Linear Inequalities
In this algebra worksheet, students solve linear inequalities. They graph their solution on a coordinate plane. There are 6 questions with answer key.
Curated OER
Fourteen Math Regent Exam Statistics Questions on Scatter Plots and Linear Regression
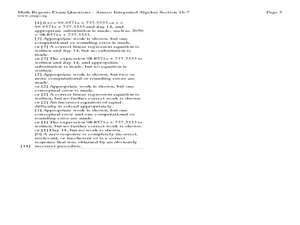
For this linear regression worksheet, students solve fourteen Math Regent Exam questions regarding scatter plots and linear regression. The solutions are provided.
Curated OER
Linear Inequalities
Ninth graders explore solving linear inequalities. They discuss vocabulary words and symbols associated with linear inequalities. After a demonstration by the teacher, 9th graders solve and graph inequalities. Students complete a...
Curated OER
Analyze The Learner; Chocolate Fractions
Third graders describe, represent and compare fractions using pieces of a chocolate bar. In this fractions lesson, 3rd graders demonstrate how to read and write fractions correctly. Students then integrate technology by using...
Curated OER
Modeling Equations with Bars
Students model linear equations using bars. In this algebra activity, students solve two steps linear equations through modeling of division, addition and multiplication. They use manipulative to solve equations.
Curated OER
Graphs and Functions
Use this series of activities to introduce learners to graphing functions. They graph both linear and quadratic equations by hand and with a Graph Sketcher Tool. Several imbedded links and handouts are included in the lesson.
Curated OER
Real World Equations!
Help your math class "get the picture" in a quadratic equation lesson that integrates digital photography. Individuals take pictures to help them model the shape of an item or situation using algebraic equations. They discover how to...


