Mathematics Vision Project
Module 6: Trigonometric Functions
Create trigonometric functions from circles. The first lesson of the module begins by finding coordinates along a circular path created by a Ferris Wheel. As the lessons progress, pupils graph trigonometric functions and relate them to...
EngageNY
Modeling with Quadratic Functions (part 2)
How many points are needed to define a unique parabola? Individuals work with data to answer this question. Ultimately, they determine the quadratic model when given three points. The concept is applied to data from a dropped...
Curated OER
Connections Involving Linear And Quadratic Functions
In this math worksheet, students determine the range of the function. Then they graph the functions while finding the coordinates on the plane.
Curated OER
Linear Functions
Students solve and graph linear equations. In this algebra activity, students collect data and plot it to create a linear function. They identify the domain and range of each line.
Curated OER
Linear Functions-Learn Your Lines
Students solve and graph linear equations. In this algebra lesson, students collect and plot data on a coordinate plane. They use the CBL and TI calculator to graph systems of equation.
Curated OER
Algebra-Based Linear Motion Problems
In this motion activity, learners determine the distance traveled, the acceleration, and velocity of different objects. This activity has 11 problems to solve.
Curated OER
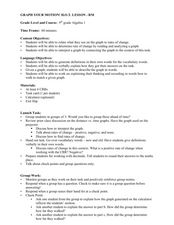
Graph Your Motion
Students graph their linear equations. In this algebra activity, students examine their lines and relate it to the slope or rate of change. They relate the steepness of the line to the slope being positive, negative or zero.
Curated OER
Building Understanding of Rate of Change/Slopes Using Alice
Students explore slope as a rate of change. In this eighth grade mathematics activity, students investigate real-world problems to determine rate of change and transform it into a linear representation, thus determining slope. Students...
Curated OER
As the Wheel Turns
This is not your typical Ferris wheel problem. In this exercise, your class will combine their knowledge of sinusoidal functions as well as linear motion to come up with parametric equations that model the position of a point on the edge...
Texas Instruments
Let's Play Ball with Families of Graphs
Learners explore quadratic equations in this Algebra II lesson. They investigate families of quadratic functions by graphing the parent function and family members on the same graph. Additionally, they write the equation of the parabola...
Curated OER
Calculus 10.2 day 2 - Vector Valued Functions
Looking for a lesson on vectors? Here is a PowerPoint that has six examples for finding velocity, acceleration, speed and direction of motion. One of the examples demonstrates the use of the TI-89 Graphing Calculator to solve a...
Curated OER
Another Way of Factoring
Focusing on this algebra instructional activity, learners relate quadratic equations in factored form to their solutions and their graph from a number of different aspects. In some problems, one starts with the original equation and...
Curated OER
Walking Home II
Students explore the relationship between distance and time. They analyze a situation involving distance traveled in a given period of time, represent the situation graphically and algebraically, and discuss the concept of slope as a...
EngageNY
The Height and Co-Height Functions of a Ferris Wheel
Show learners the power of mathematics as they model real-life designs. Pupils graph a periodic function by comparing the degree of rotation to the height of a ferris wheel.
Curated OER
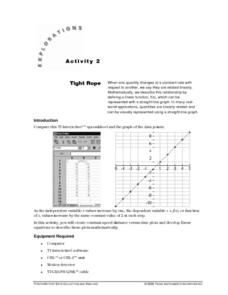
Tight Rope
Learn how to explore the concept of linear functions. In this linear functions lesson, students collect linear data from a motion detector. Students walk to create a linear function. Students plot the points on a graph...
Curated OER
Mathematical Techniques - Basic Graphing
Young scholars are introduced to significant figures and how to add, subtract, multiply and divide them. In a group, they practice plotting data points from a table to a graph and labeling all axes. They calculate the slope and...
Curated OER
Waves
In this waves worksheet, students read about harmonic and linear motion in waves as well as the two types of waves. They match 5 terms to their definitions about the structure of waves, they solve for the wavelength, frequency and...
EngageNY
Motion Along a Line – Search Robots Again
We can mathematically model the path of a robot. Learners use parametric equations to find the location of a robot at a given time. They compare the paths of multiple robots looking for parallel and perpendicular relationships and...
Chemistry Collective
Chemical Potential: Staircase Demonstration
It's all uphill from here! Scholars examine the pattern of random particle motion up a staircase. The simulation shows how the linear increase in energy corresponds to an exponential decrease in particle concentration.
Curated OER
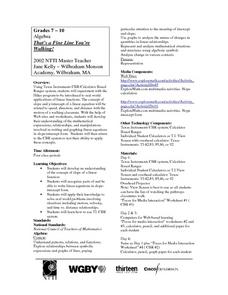
That's a Fine Line You're Walking!
Pupils experiment with Hiker program to practice real world applications of linear functions and develop their understanding of expressions, relationships, and manipulations involved in writing and graphing linear equations in...
Curated OER
Move It
Studens collect and graph data. In this algebra instructional activity, students use a CBL and CBR with a TI Calcualtor to observe linear graphs. They use the correct vocabualry as they discuss the collected data.
Curated OER
Let's Go Slopey
Young scholars create a table of values to graph a line. In this algebra lesson, students identify the slope and intercept of a linear equation. They use a Ticalculator to graph their function.
Curated OER
Atlatl Lesson Grades 4-12
Tenth graders explore the weapons of the Aboriginal people. In this tenth grade mathematics lesson, 10th graders investigate how throwing with an atlatl increase the speed of the dart as it is thrown. Students calculate the speed for...
Curated OER
It's a Drag!
Students create number lines using decimals and whole numbers. In this algebra lesson, students graph and solve linear equations. They plot ordered pairs on a coordinate plane correctly.


