Virginia Department of Education
Logarithmic Modeling
Explore logarithms and logarithmic regression. Young mathematicians first learn about inverse functions and about the logarithm function family. They take their newfound knowledge to use logarithmic functions to model situations and...
Curated OER
Lesson 6-7: Scatter Plots and Equations of Lines
In this scatter plot worksheet, students examine tables and write a linear equation that matches the table. Students graph linear equations. They read scatter plots, determine the trend line, and write a linear equation to match...
Curated OER
Matchstick Math: Using Manipulatives to Model Linear, Quadratic, and Exponential Functions
Playing with matches (unlit, of course) becomes an engaging learning experience in this fun instructional unit. Teach pupils how to apply properties of exponential functions to solve problems. They differentiate between quadratic and...
Curated OER
Linear and Exponential Models
Students linearize data to determine if an exponential model is suitable. For this linearizing data to determine if an exponential model is suitable lesson, students graph the residuals of sets of data that appear to have an exponential...
Curated OER
Regression Analysis
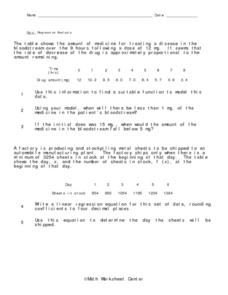
In this regression analysis worksheet, 9th graders solve 10 different word problems related to regression analysis. First, they use the information given to find a suitable function to model the data. Then, students use the model to...
Intel
Track the Trends
Allow your classes to research what interests them. An engaging STEM lesson, the fourth in the series of six, asks individuals to choose a topic of interest and analyze the data through regression models. The regression equations allow...
EngageNY
Exponential Growth—U.S. Population and World Population
Show how exponential growth can look linear. Pupils come to understand the importance of looking at the entire picture as they compare the US population to the world population. Initially, the populations look linear with the same rate...
Curated OER
Linear and Exponential Models
Students investigate the differences between linear and exponential models. In this linear and exponential models lesson, students make a table of given data. Students determine if the data is linear or exponential by plotting the data...
Mathalicious
XBOX Xpotential
Touchdown! This is an exponentially insightful instructional activity that explores the growth of football games with different video game consoles. Class members discuss whether the increase of mergahertz can be described as linear or...
Curated OER
US Households
Learners construct and use inverse functions to model a real-world context. They use the inverse function to interpolate a data point.
Statistics Education Web
The United States of Obesity
Mississippi has both the highest obesity and poverty rate in the US. Does the rest of the data show a correlation between the poverty and obesity rate in a state? Learners tackle this question as they practice their skills of regression....
Mathematics Vision Project
Module 9: Modeling Data
How many different ways can you model data? Scholars learn several in the final module in a series of nine. Learners model data with dot plots, box plots, histograms, and scatter plots. They also analyze the data based on the data...
Curated OER
The Barbie Bungee Drop
What do math, bungee jumping, and Barbie® have in common? Young adventure seekers use rubber bands as bungee cords to predict a thrilling, but safe, jump for their doll. First, test jumps are conducted with a few rubber bands. Then more...
PBL Pathways
Students and Teachers
Predict the future of education through a mathematical analysis. Using a project-based learning strategy, classes examine the pattern of student-to-teacher ratios over a period of years. Provided with the relevant data, learners create a...
Statistics Education Web
Text Messaging is Time Consuming! What Gives?
The more you text, the less you study. Have classes test this hypothesis or another question related to text messages. Using real data, learners use technology to create a scatter plot and calculate a regression line. They create a dot...
Curated OER
Strike a Pose: Modeling in the Real World (There's Nothing to It!)
Adjust this lesson to fit either beginning or more advanced learners. Build a scatter plot, determine appropriate model (linear, quadratic, exponential), and then extend to evaluate the model with residuals. This problem uses real-world...
Curated OER
Looking at Exponential and Linear Models
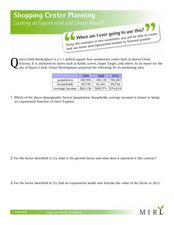
For this shopping center worksheet, students use exponential and linear models to complete word problems about a shopping center. Students complete 6 problems.
Curated OER
Linear Functions-Learn Your Lines
Students solve and graph linear equations. In this algebra activity, students collect and plot data on a coordinate plane. They use the CBL and TI calculator to graph systems of equation.
Radford University
At the Gas Pump
Given the price of crude oil, gasoline, and diesel for the past several years, pupils plot the data to determine whether a correlation exists. Learners determine a regression line and predict the price of gasoline and diesel in the...
Radford University
Down on Sue's Farm
When would a farmer use math? Class members work through five tasks on a farm that require knowledge of surface area, volume, and determining regression equations. The challenges range from figuring out the amount of paint to buy,...
EngageNY
Graphs of Quadratic Functions
How high is too high for a belly flop? Learners analyze data to model the world record belly flop using a quadratic equation. They create a graph and analyze the key features and apply them to the context of the video.
Curated OER
Scatterplots and Regressions
In this scatterplots and regressions worksheet, students solve 6 different types of problems related to graphing scatterplots and interpreting regressions. First, they create a scatterplot from the given data coordinates and then,...
Balanced Assessment
Monitor Pricing
Out with the old and in with the new. Learners use a set of prices of computer monitors from 1994 to make a prediction. They then use one current price and what they know about the old prices to make a more recent prediction. Their...
Curated OER
Modeling Population Growth
Students collect data on population growth. In this statistics lesson, students graph their data and make predictions. They find the linear regression and the best fit line.


