Curated OER
A Sweet Drink
Young scholars investigate reaction rates. In this seventh or eighth grade mathematics lesson, students collect, record, and analyze data regarding how the temperature of water affects the dissolving time of a sugar cube. Studetns...
Kenan Fellows
Density
Most scholars associate density with floating, but how do scientists determine the exact density of an unknown liquid? The third activity in a seven-part series challenges scholars to find the mass and volume of two unknown liquids. Each...
Curated OER
How Dense is Salt Water?
Young schoolers explore the concept of linear regression. They determine the mass and density of salt water. Pupils add salt to water and record the density as salinity increases, and perform a linear regression on the data to model the...
Curated OER
Is there Treasure in Trash?
More people, more garbage! Young environmentalists graph population growth against the amount of garbage generated per year and find a linear model that best fits the data. This is an older resource that could benefit from more recent...
Beyond Benign
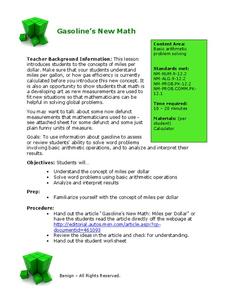
Got Gas
How much gas does it take to drive around town? The class uses a variety of mathematical procedures to take a look at the use of gas for transportation. Class members use a different unit to determine the cost of driving a car as opposed...
Curated OER
Shake It Up with Scatterplots
Students identify how to use a scatterplot to compare two sets of data to determine if they are related. Then they identify and describe the definition of regression line (the "line of best fit"). Students also identify how scientists...
Teach Engineering
Linear Regression of BMD Scanners
Objects may be more linear than they appear. Scholars investigate the relationship between the number of bone mineral density scanners in the US and time. Once they take the natural logarithm of the number of scanners, a linear...
American Chemical Society
Investigating the Line
Note that this activity is best paired with the preceding activity in the unit. In that activity, elementary physical scientists observed that the color coating of M&Ms® candies do not mix when dissolved off of the chocolate surface....
Teach Engineering
Exploring Variables While Testing and Improving Mint-Mobiles (for High School)
Mint candies are good for more than just one's breath. Using basic materials such as mint candies, straws, index cards, and Popsicle sticks, scholars create race cars that meet a given budget as well as design constraints. They perform...
Curated OER
Bungee Jump Lab
Student apply linear relationships to the real world. They use Ken and Barbie dolls and experiment to find the line of best fit. They collect data, analyze data, and make predictions from it. The students also use Microsoft Power Point...
Curated OER
Fitting Periodic Functions-Distant Planets
For this periodic functions worksheet, students use given data of the speed of a star and find the best fit periodic function that follows the trend in data. They determine the amplitude, offset phase and the formula for the angle. They...
Serendip
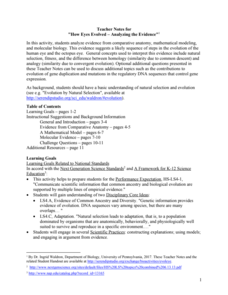
How Eyes Evolved – Analyzing the Evidence
Octopodes existed for hundreds of thousands of years before humans, yet our eyes share many similarities. Scholars analyze the evidence to determine if the evolution of eyes best fits a homology or analogy model. They discuss the issue...
It's About Time
Coal and Your Community
When I was young, I was afraid of the dark. Now I am afraid of getting the electric bill. This fourth lesson in a series of eight focuses on coal mining, conservation, and energy efficiency. Scholars start by taking data from a table and...
Curated OER
A Simple Thermoetric Titration
In this thermometric titration worksheet, high schoolers investigate the changes in temperature when an alkali is neutralized by an acid. Students graph their results from the titration and draw 2 best fit lines on their graph. Where the...
Chemistry Collective
Chemical Potential: Staircase Demonstration
It's all uphill from here! Scholars examine the pattern of random particle motion up a staircase. The simulation shows how the linear increase in energy corresponds to an exponential decrease in particle concentration.
Curated OER
Checking Test Comparability/Scattergrams
Students construct a scattergram graph. In this statistics lesson, students graph data by hand and using a spreadsheet program. They establish lines of best fit and draw conclusions using their graphs.
Curated OER
Water Cycle Relay
Students review the steps in the water cycle by playing a game to fill in the missing words in the cycle. Students read a water cycle riddle and decide which word best fits the riddle.
Science Geek
Covalent Bonding
When it comes to covalent bonds, sharing is caring. Presentation covers the octet rule with multiple examples, Lewis Dot Structures with an example, and resonance. Presentation is the first in a five-part series.
Curated OER
Designing an Earthquake-resistant Structure
Students attempt to design and build the most stable "earthquke resistant" structure. They create model buildings and test them on a shake table to see which design holds up the best.
Curated OER
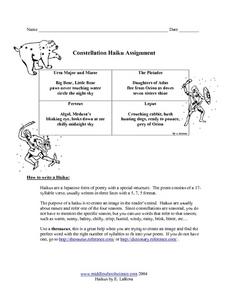
Constellation Haiku Assignment
In this constellation haiku worksheet, students create a poem with a 17-syllable verse that paints a picture about a constellation. They use words that refer to the seasons since constellations are seasonal. Students can use a thesaurus...
Curated OER
Stars and Slopes
More of a math lesson plan than physics or space science, high schoolers take a set of data and plot it on a log-log coordinate system. The write-up for day two was never completed, but day one, "Stars and Slopes," is complex and...
Curated OER
View Tubes: Student Worksheet
Here is a activity that is almost a lesson! In it, learners conduct an experiment in which they determine the size of objects when viewed through viewing tubes. This resource has all of the instructions and tables necessary to complete...
Curated OER
Coming to Know F and C
Pupils collect temperatures using a probe and examine data. In this temperature lesson students complete an activity using a graphing calculator.
WK Kellogg Biological Station
Plotting Phenology
Finally, a worksheet that involves more than filling in some blanks. Your budding ecologists must graph and analyze three sets of data, then synthesize the information as they think about the impacts of plant reproduction on insects and...


