Curated OER
Human Effect
Students investigate changes in air quality. In this science lesson, students compare data to determine the air quality. Students explore how humans affect the air quality.
Curated OER
How Does the Earth's Energy Budget Relate to Polar Ice?
Students use satellite data to see how radiation budget relates to the ice that is present in the North. In this energy instructional activity students correlate data to see a relationship.
Curated OER
Baseball Challenge - Basic Geography Skills
A fabulous presentation/activity based on geography. The author has designed a "baseball game" where batters advance to the next base if they correctly answer a multiple choice question about geography. Geographic terms are used, along...
Curated OER
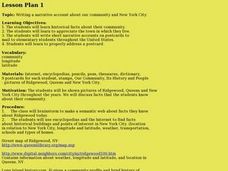
Our community and New York City
Fourth graders research websites to gather information about New York City and the Ridgewood community. In this New York City and Community lesson, 4th graders make a semantic map. Students write short postcards to send to students...
Curated OER
Seasonal Cloud Cover Variations
Students, in groups, access data from the NASA website Live Access Server regarding seasonal cloud coverage and the type of clouds that make up the coverage. They graph the data and make correlations between types, seasons and percentages.
Curated OER
Are We Falling Apart? Exploding Volcanoes
Students research and demonstrate volcanic activity. In this volcanism lesson, students research the types of volcanoes and define related terms using the Internet. They demonstrate volcanic activity with water, corn syrup, and flour.
Curated OER
Maps
Maps, globes, and computer software aid young explorers as they locate state capitols, major cities, geographic features, and attractions for states they are researching. They then use desktop publishing software to create a map to share...
Curated OER
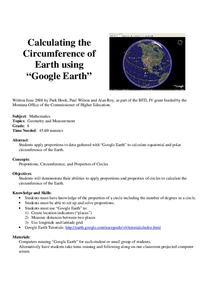
Calculation the Cricumference of Earth using "Google Earth"
Eighth graders investigate properties of circles. For this eight grade mathematics lesson, 8th graders apply proportional reasoning to data gathered with “Google Earth” to calculate equatorial and polar circumference of the...
Curated OER
Natural Disasters and the Five Themes of Geography
Have your class do research on natural disasters and create a presentation using this resource. In completing this activity, learners apply the five geography themes to their research. They write a paper describing their results. It's a...
Curated OER
Ocean Currents and Sea Surface Temperature
Students use satellite data to explore sea surface temperature. They explore the relationship between the rotation of the Earth, the path of ocean current and air pressure centers. After studying maps of sea surface temperature and ocean...
Curated OER
The Equator
Learners investigate cultures located along the equator. In this geography skills lesson, students research the geography, history, culture, and tourism of Ecuador, Indonesia, Kenya, Brazil, and Singapore. Learners write an article based...
Curated OER
Earth from Space Maps
Students use photo images from space to create a large map of the United States or the world, find where they live and label other places they know. They are exposed to a Web resource that allows them to view photo images of Earth taken...
Curated OER
Comparison of Snow Cover on Different Continents
Students use the Live Access Server (LAS) to form maps and a numerical text file of snow cover for each continent on a particular date and analyze the data for each map, corresponding text file to determine an estimate of snow cover for...
National Wildlife Federation
I’ve Got the POWER Wind Energy Potential at Your School
The 20th lesson in a 21-part series connects the wind data and expectations of a turbine to whether such devices should be built in your area. Scholars begin with estimating the wind potential at school by using long-term climate...
National Wildlife Federation
I Speak for the Polar Bears!
Climate change and weather extremes impact every species, but this lesson focuses on how these changes effect polar bears. After learning about the animal, scholars create maps of snow-ice coverage and examine the yearly variability and...
Curated OER
Creating Climographs
Students use satellite data to compare precipitation and surface temperatures on different islands. In this satellite lesson plan students create graphs and explain the differences between weather and climate.
Curated OER
Baseball Challenge: Social Studies TCAP
Using a baseball theme, this presentation provides a review of social studies topics covered in sixth grade. Students play a game in which they score based on the answers to various questions involving Ancient Rome, Ancient Greece, map...
University of Colorado
Phases of Charon
Pluto, although no longer considered a planet, has five moons. Pluto's moon, Charon, is the focus of a resource that describes how the moon is viewed from the surface of Pluto. Photos help individuals see how Charon would look at...
Concord Consortium
Center of Population
Let the resource take center stage in a lesson on population density. Scholars use provided historical data on the center of the US population to see how it shifted over time. They plot the data on a spreadsheet to look the speed of its...
Mr. Head's 6th Grade Classroom
Absolute Location
How do we know where we are in the world? A presentation for middle schoolers explains absolute location and other geography terms such as relative location. It also gives scholars the opportunity to practice finding absolute location on...
Curated OER
Applications of the Pythagorean Theorem - Magnetism
Middle and high schoolers use the Pythagorean Theorem to complete a table showing with the magnetic field strengths in given cities. They find the average value of the Earth's magnetic field and plot one of the three-dimensional values...
Curated OER
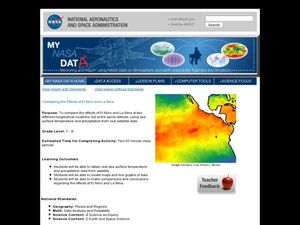
Comparing the Effects of El Nino and La Nina
Students examine the differences between an El Nino and La Nina year. In this investigative lesson plan students create maps and graphs of the data they obtained.
Curated OER
Solar Cell Energy Availability From Around the Country
Students determine areas that are the most likely to produce solar energy by using NASA data. In this solar energy lesson students analyze plots and determine solar panel use.
Curated OER
True North, Magnetic North
Young scholars explain why compass angles need to be corrected for regional magnetic variation. They observe the difference between magnetic and true north. Each student measures the angle of variation for a town in a different state.
Other popular searches
- Latitude and Longitude
- Latitude Longitude
- Latitude and Longitude Games
- Latitude & Longitude
- Latitude and Longitude Maps
- Longitude and Latitude Game
- Longitude and Latitude Math
- Geography Latitude Longitude
- Whaling Latitude Longitude
- Longitude Latitude Minutes
- Longitude and Latitude Lines
- Volcano Latitude Longitude


