EngageNY
Displaying a Data Distribution
Pupils analyze a display of data and review dot plots to make general observations about the highest, lowest, common, and the center of the data. To finish, learners match dot plots to scenarios.
Curated OER
The Art of Interpreting Percent
Ddefine the relationships between fractions, decimals, and percentages in a series of lessons. The class practices converting between these three versions of a number. They also find the common factor of a numerator and denominator and...
Curated OER
Fantastic Fractions
Fourth graders work with fractions using hands on experiences and reasoning skills and use fractions to communicate the idea of a part of a whole.
Curated OER
Chapter 34: Income Inequality and Poverty
Displaying the causes, trends, and effects of income inequality, this presentation covers the wide gap between wealth and poverty in the United States. The navigational tool will help lecturers guide the conversation. The key terms in...
Illustrative Mathematics
Comparing Temperatures
Which is colder -12 or -18? Temperature is natural real-world application of ordering rational numbers. It's also fun to talk about the lowest recorded temperature on Earth. Take the time to discuss this inquiry with your class.
Code.org
The Need for Algorithms
Pairs work through two scenarios that require them to generate an algorithm. The first activity requires pairs to define a common language to use; the second comes with the language. The pairs then must determine how to code the...
Curated OER
Subtracting Fractions with Unlike Denominators
Students solve fractions using subtractions and. In this algebra activity, students use the correct steps to solve fractions with unlike denominators when adding and subtracting. They solve by finding a common denominator and...
Curated OER
Mathematics: Domino Theory
Sixth graders use dominos and plastic chips to study common denominators and fractions. They describe how these operations are related to each other.
EngageNY
Exploring the Symmetry in Graphs of Quadratic Functions
Math is all about finding solutions and connections you didn't expect! Young mathematicians often first discover nonlinear patterns when graphing quadratic functions. The lesson begins with the vocabulary of a quadratic graph and uses...
Oxfam
Sweatshops - Exploitation Is Never in Fashion
Here's a resource that brings home the idea that we are all part of a global community, that our actions have far reaching consequences. Class members examine the labels in their clothes, create a list of the manufacturers, the countries...
Illustrative Mathematics
Tides
A very simple example of a functional relationship between depth of water and time is shown here. In fact, it might be more useful to use a coastal tide book to better illustrate this real-world experience. Pupils are to count the number...
Curated OER
Mean Meadian and Mode
Students apply central tendencies to given data. In this statistics lesson, students calculate the mean, median, and mode as it relates to their data. They collect data and graph it while identifying the way the numbers are ordered.
Curated OER
Application Problems with Fractions
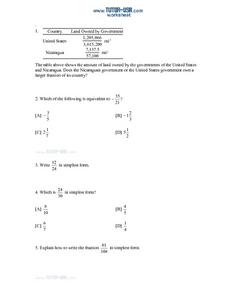
In this math worksheet, students compare fractions from a chart. They simplify six fractions. Students tell the fraction of a day they spend doing various activities. Each fraction is simplified. Three problems are multiple choice problems.


