EngageNY
Creating a Dot Plot
Which dot am I? Pupils create dot plots to represent sample data through the use of frequency tables. The third segment in a series of 22 asks individuals to analyze the dot plots they created. The scholars translate back and forth...
Curated OER
Ordering Numbers to 1000 (D)
In this ordering numbers worksheet, students order the Christmas ornaments from lowest number to highest number using the lines on the right.
K12 Reader
Displaying Data
It's important to learn how to display data to make the information easier for people to understand. A reading activity prompts kids to use context clues to answer five comprehension questions after reading several paragraphs about...
101 Questions
Circle-Square
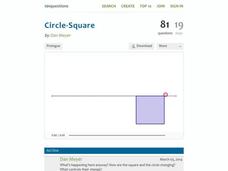
How do the area and perimeters of circles and squares compare? A clever video illustrates the change in the area of a circle and square while their total perimeter stays the same. The task is for learners to predict the point where the...
Curated OER
Sub-Atomic Particles and Energy
In this atomic particles worksheet, students complete an elements chart comparing atomic number, mass number, protons, neutrons, and electrons. Students write the electron configuration for atoms. This worksheet has 1 graphic organizer...
Curated OER
Eye Spy a Pattern
Fifth graders examine how to see patterns by showing how things work together. They identify, analyze and determine a rule for predicting and extending numberical patterns involving operations of whole numbers, decimals and fractions.
Curated OER
Introduction to Descriptive Statistics with Mode, Median, Mean and Range
Students complete several games and experiments, tally and graph their results. They figure the mean, median, range and/or average of their graphs to describe class results. They consider which statistic best represents the data at hand.
Curated OER
What's the Difference?
In this integers worksheet, students solve and complete 4 different problems that include determining various integers in temperature. First, they use the thermometers shown to graph the difference between the highest and lowest...
Curated OER
Electromagnetic Spectrum
In this electromagnetic spectrum worksheet, students review all regions of the spectrum in order from longest to shortest wavelength. Students list all possible values for specific quantum numbers. This worksheet has 20 problems to solve.
Curated OER
Number Ordering 2
In this ordering numbers activity, students order 1 to 3 digit numbers in each problem. Students order 5 numbers in each of the 4 problems.
Curated OER
Highest Common Factor and Lowest Common Multiple
In this factors and multiples worksheet, students solve 50 problems in which the greatest common factor (GCF) and the lowest common multiple (LCM) are calculated. This page is intended for online use but may be completed on paper.
Center Science Education
Torrents, Droughts, and Twisters - Oh My!
What is causing the extreme weather happening around the planet? Middle and high schoolers read about climate change as a possible link to such phenomena. Then they form groups to discuss and research one of the types of weather events....
Curated OER
Number Ordering
Students complete number ordering activities in an online format. In this number ordering lesson, students get a number from 0 to 30 and then participate in a timed exercise to order the numbers. Students split into odd and even numbers,...
Curated OER
Power Walk and Jog
Throw in something different for your runners to focus on while they walk, jog, or run for five and a half minutes. Each time the runner passes you, hand them a playing card. There are several ideas on how to use them as motivators:...
Curated OER
Taking Attendance
Young mathematicians record and analyze data. They will take attendance for their class and compare to other days. Then discuss ways to count who is present. They may also show the amount of students present using fractions.
Curated OER
Review Set
The topics covered in these multiple choice questions are about atomic structure and bonding, state configurations, pressure and solution concentration, and energy graphs. This is a midterm review which could be used with the whole...
Curated OER
Lesson Plan for Fontana Mines
Students estimate and compute with rational numbers. They compare, order and convert among fractions, decimals and percents. Students analyze problems to determine if there is sufficient or extraneous data to solve.
Curated OER
Extreme Elevations
Seventh graders use highest and lowest points of land elevation around the world to find the differences. Sea level is zero, so students be operating with positive and negative numbers. After students find the information on the...
Curated OER
Mean Meadian and Mode
Students apply central tendencies to given data. In this statistics lesson, students calculate the mean, median, and mode as it relates to their data. They collect data and graph it while identifying the way the numbers are ordered.
Curated OER
What Can Data Tell Us?
Students analyze data they have collected themselves and by their classmates. In groups, they create data distributions to identify the highest, lowest and middle values. As a class, they discuss the concept of sample size and how it can...
Curated OER
Graphing Quadratic Equations
Review the form of a quadratic function, and the parabola it creates. Continue on with the whole group to work through a mini-lab, practicing how to graph quadratic equations with one variable. The goal of this lesson is for the group...
Curated OER
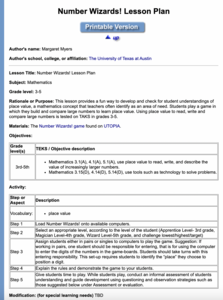
Number Wizards! Lesson Plan
Students play a game in which they build and compare large numbers to learn place value. They use place value to read, write and compare large numbers.
Curated OER
Are Our Chemical Measurements Accurate or Precise?
What is the difference between accuracy and precision? This worksheet has students define the terms accuracy and precision, and compare bulleye diagrams to find examples of both. Students analyze given data and determine the accuracy and...
Curated OER
American Political Culture
Examine American political culture with your scholars using this self-assessment lesson. Individuals rate a list of 14 values from highest to lowest, including ideas such as financial security, right to private property, justice,...


