Yummy Math
US Holiday Candy Sales
Candy is a big business! Calculate the amount of money consumers spent on major holidays—Easter, Halloween, Christmas, Hanukkah, and Valentine's Day—based on the total amount of candy sales from 2011 and the percentage of each holiday's...
Curated OER
Tiles, Blocks, Sapphires & Gold: Designing a Treasure Map
Young cartographers in groups hide treasure at school and then create a map to find it using pattern blocks and tiles. They make paintings with clues to create a visual representation of the location of their treasure. Groups present...
Curated OER
Energy Choices
Students add and multiply decimals to complete gas choice worksheets. They discover which gas supplier has the best gas prices. Students collect and interpret data about local natural gas suppliers and use this information...
Curated OER
Lemonade Stand: Making Money the Old-Fashioned Way
Young scholars run their own lemonade stand and are to figure out what to sell the lemonade at to gain the maximum profit.
Curated OER
Is the Hudson River Too Salty to Drink?
Students explore reasons for varied salinity in bodies of water. In this geographical inquiry lesson, students use a variety of visual and written information including maps, data tables, and graphs, to form a hypothesis as to why the...
Curated OER
How can we keep our forests intact and have chocolate too?
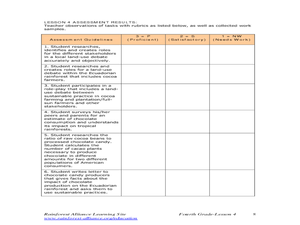
Fourth graders recognize the need to sustain crops in the rainforest. In this rainforest lesson, 4th graders consider the use of products from the rainforest. Students discuss how people of different points of view decide what...
Curated OER
Touring Delmarva
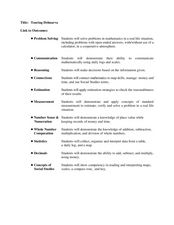
Students plan a trip. In this trip planning instructional activity, students use a map to find where they would like to visit with a pretend family of 4. They get a specific amount of money and time and need to decide where they...
Curated OER
The Good, The Bad, The Ugly
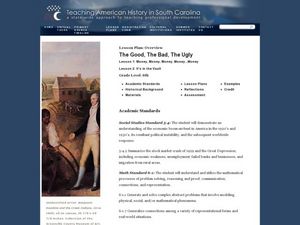
Sixth graders examine the causes of the stock market crash of 1929. In this integrated math/history unit on the stock market, 6th graders study, research, and read stocks, visit a local bank, and create a PowerPoint to show the...
Curated OER
Statistical Drug Abuse and Adolescents in the U.S.A.
Young scholars examine statistics of teenagers using alcohol and marijuana. In groups, they brainstorm the reasons why they believe usage is higher than in years past. As a class, they role-play different roles in scenerios to help them...
Curated OER
Favorite Christmas Carols
Third graders take a survey of friends' and family members' favorite Christmas carols. They illustrate a favorite Christmas carol and have students try to guess the name of the carol based on the picture.
Curated OER
My Building, My Community
Learners become familiar with the concepts of community and neighborhood and what buildings are associated with these. In this neighborhood activity, students tour the neighborhood as a class, observing and taking photos of the local...
Curated OER
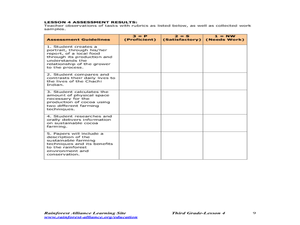
Equadorian Rainforest: The Tropical Supermarket
Students study the concept of sustainable agricultural practices through cocoa farming and the lives of the people who are the producers. Students watch a slide show and read a story which helps them understand the origins of chocolate,...
Curated OER
Inventors Unit Survey
Students develop and conduct a survey for their inventors unit. They create a five question survey and tally the survey results, and create a graph using Microsoft Word and Graph Club 2.0.
Curated OER
Graphing Regions: Lesson 2
Students identify and analyze geographical locations of inventors. They each identify where their inventor is from on a U.S. map, discuss geographic patterns, and create a t-chart and graph using the Graph Club 2.0 Software.


