EngageNY
Three-Dimensional Space
How do 2-D properties relate in 3-D? Lead the class in a discussion on how to draw and see relationships of lines and planes in three dimensions. The ability to see these relationships is critical to the further study of volume and...
Statistics Education Web
Are Female Hurricanes Deadlier than Male Hurricanes?
The battle of the sexes? Scholars first examine data on hurricane-related deaths and create graphical displays. They then use the data and displays to consider whether hurricanes with female names result in more deaths than hurricanes...
Curated OER
Problem-Solving Application: Use Operations
In this math operations learning exercise, students problem solve 3 math word problems involving a table, addition, division, multiplication and division.
Curated OER
Graphs of Formulas
In this worksheet students fill out a function table after reading a short word problem. This is a good way for students to practice the necessary skills for solving word problems or setting up algebra equations.
Curated OER
Algebra: Variable and Functions (Homework 21.4)
In this algebra worksheet, students complete 4 function tables. Students plug in the different values for x to complete the y sides of the charts.
Curated OER
Histograms
In this histograms instructional activity, students solve 5 word problems based on a histogram of presidential ages at their inauguration. Next, students create a frequency table and a histogram based on a list of data which shows the...
Curated OER
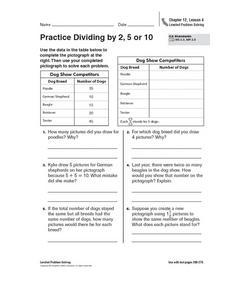
Practice Dividing by 2, 5, or 10
For this pictograph problem solving worksheet, students analyze the data on a table and create a pictograph. Students read and solve 6 story problems about the pictograph.
Curated OER
Variables and Expressions Quiz
In this variables and expressions instructional activity, 6th graders complete a quiz involving the evaluation of 9 expressions and variables. Students find the expression that makes 3 tables true.
Curated OER
Problem-Solving Strategy: Use Logical Reasoning: Reteach
In this math tables instructional activity, students review the word problem to gain an understanding of the information in the table. Students then review the use of the model to solve the word problem. Students then use the same steps...
Curated OER
Make a Tally
In this tally chart learning exercise, students read the word problems and use the information within the problem to make a tally chart. Students use the tally charts to help them finish and solve the word problem.
Curated OER
Make Line Graphs
In this graphing worksheet, 5th graders use 2 line graphs to answer 4 word questions. They use data from two charts to make a single and a double line graph.
Curated OER
4th Grade Math Practice
In this grade 4 math practice activity, 4th graders complete a set of 23 multiple choice questions related to a variety of 4th grade concepts. An answer key is included.
Curated OER
Math for Fourth Grade: Statistical Charts
In this math for fourth grade statistical charts activity, 4th graders answer 7 multiple choice questions in standardized test format about data, charts and graphs.
Curated OER
Sir Cumference and the First Round Table
In this circumference worksheet, students solve and complete 5 different figures illustrated on the sheet. First, they cut out each shape found on the bottom. Then, students use the shapes on the left as clues to create the corresponding...
Curated OER
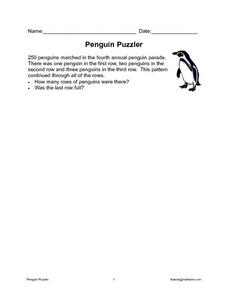
Penguin Puzzler
In this math penguin word problem worksheet, students problem solve a math problem scenario involving 250 penguins marching in a penguin parade.
Curated OER
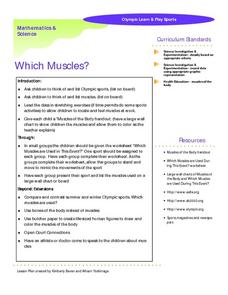
Which Muscles?- Olympic Learn and Play Sports
In this math, science, and physical education worksheet, learners brainstorm and study about the muscles that are used while participating in different Olympic sports. They color the muscle groups of the body by follow the directions...
Curated OER
Graphing
In this algebra worksheet, students make a table and graph their linear equations. There are 4 problems to be solve by find x and y values.
Curated OER
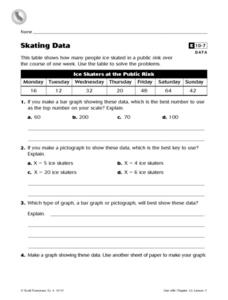
Skating Data
In this collecting data activity, 4th graders view a table on ice skaters at a public rink in order to answer 2 multiple choice questions, 1 short answer question and make a graph showing one piece of the data.
Curated OER
Using a Chart or Table
In this charts and tables worksheet, learners follow directions on setting up charts or tables to help them solve time and addition word problems. Students complete 3 problems.
Inside Mathematics
Suzi's Company
The mean might not always be the best representation of the average. The assessment task has individuals determine the measures of center for the salaries of a company. They determine which of the three would be the best representation...
Noyce Foundation
Toy Trains
Scholars identify and continue the numerical pattern for the number of wheels on a train. Using the established pattern and its inverse, they determine whether a number of wheels is possible. Pupils finish...
Curated OER
Multiples of 7
What is three sevens? What about five sevens? Practice times tables with a activity that provides several ways to multiply seven by different numbers. The last section features two word problems and spaces to write the answers. This...
Curated OER
Make Ten to Add
In this making ten worksheet, students learn to use pictographs or math tables to help them learn to make ten in addition word problems.
Illustrative Mathematics
Average Cost
Here is an activity that presents a good example of a function modeling a relationship between two quantities. John is making DVDs of his friend's favorite shows and needs to know how much to charge his friend to cover the cost of making...


