Mathematics Assessment Project
Shelves
Don't leave this task on the shelf — use it is assess middle schoolers understanding of patterns. Participants try to discover a pattern in the number of bricks and planks used to make shelves. They then match descriptions...
Bowland
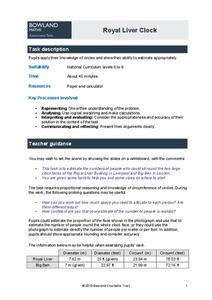
Royal Liver Clock
Using clocks as dining tables? Scholars estimate the number of people that can sit around the face of the clock on the Royal Liver Building in Liverpool. They use estimation to justify their responses.
National External Diploma Program Council
Finding an Average
Young hopefuls can practice finding the average of a group of numbers represented in tables and word problems.
Willow Tree
Line Graphs
Some data just doesn't follow a straight path. Learners use line graphs to represent data that changes over time. They use the graphs to analyze the data and make conclusions.
Illustrative Mathematics
Electoral College
A cross-curricular resource that takes the electoral votes and allows your learners to organize and analyze the data. Young voters can determine which states are more influential and interpret the dotplot provided for more data....
Illustrative Mathematics
Dimes and Quarters
Here is a coin problem where the algebra learner determines the pair of linear equations needed to solve the system. Whether the equations are taken from a table, or your scholars recognize the format of a coin problem, it is an...
West Contra Costa Unified School District
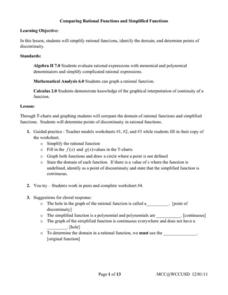
Comparing Rational Functions and Simplified Functions
What kind of functions have holes in their graphs? Here, the teacher guides the class on how to use the simplified function of a rational function to aid in the graphing of the original rational function. T-tables are used in order...
Curated OER
Math: O.R.E.O. Woes
In this math worksheet, 3rd graders apply basic operations to answer six questions about Oreo cookies. Next, they create four math problems using pictures and number sentences.
Curated OER
Line Plots - Homework 6.3
Elementary schoolers use data in a table to make a line plot, then answer five related questions. Houghton Mifflin text is referenced.
Mathed Up!
Histograms
Class members explore how to read and use histograms by watching a video on creating and analyzing histograms. To finish, the class works on a set of questions that tests these skills.
Curated OER
Multiplication Table: Facts From 1-12
For this multiplication worksheet, students complete a multiplication table with facts from 1- 12. There are some numbers provided as hints.
Curated OER
New York State Testing Program Grade 8 Math Sample Test 2005
In this New York state sample test activity, 8th graders solve thirty-three sample math problems designed to help students prepare for the grade eight math test. Tips for taking the test are provided.
Curated OER
Worksheet 15-Fall 1995
In this math worksheet students use the intermediate value theorem to solve two problems. They find parallel lines that will cut a convex shape into two pieces with equal areas. Students repeat this problem with a concave shape. Students...
Curated OER
Double Bar Graphs - Practice 7.1
In this double bar graph worksheet, students make a double bar graph from given information, then solve related problems in addition to 2 test prep problems. Houghton Mifflin text referenced.
Curated OER
Using Parallel Axes To Discover Mathematical Interconnections
In this math worksheet, middle schoolers graph the functions on parallel axes and observe the location of the slope point in relation to the x and y axes.
Curated OER
Worksheet 10: Continuous Functions
In this math worksheet, students answer 7 questions regarding continuous functions, domains, differentiables, and inverse functions.
Curated OER
1st Grade Math Review
In this math review worksheet, 1st graders respond to 20 multiple choice questions that serve as a review of addition facts, subtraction facts, odd and even numbers, and calendar skills.
Curated OER
Doing Math with Hudson River Shipping
In this Hudson River shipping instructional activity, middle schoolers record information about various vessels seen on the Hudson River and respond to the questions that follow. They determine how many miles the Gypsum Baron traveled...
Curated OER
4th Grade Math Quiz
In this grade 4 math quiz activity, 4th graders complete a 15 question multiple choice quiz covering a variety of grade 4 concepts.
Curated OER
Visualize 3-D Objects and Make Nets of Common Solids
In this 3-D objects and common solids worksheet, students cut out and count the number of faces on several different types of boxes and make a cuboid from straws or a card. Kids fill out 4 different categories involving 5 different types...
Curated OER
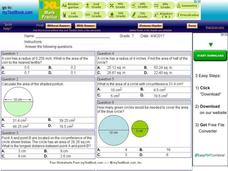
Ten Multiple-Choice Circle Problems
In this circle worksheet, students solve ten multiple-choice questions concerned with the area, radius, diameter, and circumference of a circle. The solutions are provided by clicking on the "show answers" button on the bottom of...
Curated OER
Number Search: Make 10
In this make ten worksheet, learners find at least 12 number sentences that equal ten either by adding, subtracting or multiplying.
Math Mammoth
Bar Graphs 1
In this bar graph activity, students organize data in a frequency table, then create a bar graph. They find the average of the data. This one-page activity contains two multi-step problems.
Curated OER
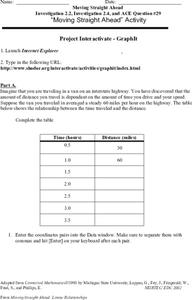
Moving Straight Ahead
In this functions worksheet, 9th graders solve and complete 24 various types of problems. First, they complete the table with the correct distance for each hour given. Then, students enter the coordinate pairs into the function table...

