Curated OER
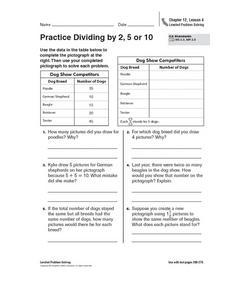
Practice Dividing by 2, 5, or 10
In this pictograph problem solving worksheet, students analyze the data on a table and create a pictograph. Students read and solve 6 story problems about the pictograph.
Curated OER
Probability Using M&M's
Students estimate and then count the number of each color of M&M's in their bag. In this mathematics lesson, students find the experimental probability of selecting each color from the bag. Students create pictographs and bar graphs...
Curated OER
One, Two, Three...and They're Off
Students make origami frogs to race. After the race they measure the distance raced, collect the data, enter it into a chart. They then find the mean, median, and mode of the data. Next, students enter this data into Excel at which time...
Curated OER
Usage and Interpretation of Graphs
Young scholars explore graphing. In this graphing lesson, students predict how many shoe eyelets are present in the classroom. Young scholars count eyelets and work in groups to organize and chart the data collected. Students put all the...
Curated OER
Talking Rocks
Third graders consider the differences between pictographs and petroglyphs. They create symbols from a story about their worlds. They make pottery art.
Curated OER
Reading the Neighborhood
First graders complete activities with the story One Monday Morning in the Macmillan/McGraw Hill Textbook. In this data lesson, 1st graders read the story and gather data to create a picture graph. They read the graph and answer...
Curated OER
Dealing with Data
Seventh graders collect and analyze data. In the seventh grade data analysis lesson, 7th graders explore and/or create frequency tables, multiple bar graphs, circle graphs, pictographs, histograms, line plots, stem and leaf plots,...
Curated OER
Talking Rocks
Third graders explain the difference between Petroglyphs and Pictographs from Ancient Native American peoples. They create symbols that are representative of a story about their world.
Pennsylvania Department of Education
Freckle Face
Students collect and record data. In this early data analysis lesson, students gather data about their partners face. As a class, the students use tally marks and pictographs to record the data and answer question about the information...
Curated OER
A Reading Graph
Students construct and interpret a "favorite classroom books" graph. In this literacy and math graphing lesson, students choose a reduced size copy of the book cover that corresponds with the book(s) they chose to read during their...
Curated OER
Pictograph to Bar Graph
Second graders explore organizing data to make it useful for interpreting picture graphs and bar graphs. They use Graphers software to create a pictograph and a bar graph.
Curated OER
Measuring Snowfall
Students predict the amount of snowfall for the week and measure snowfall. In this measuring snowfall lesson, student use a precipitation gauge to measure the week's snowfall; and analyze the data to determine whether or not...
Curated OER
Weather Observation Journal
Students record weather for a period of one month. In this weather lesson, students observe weather for one month on a large pictograph. Students record clouds, wind, temperature and any other weather conditions they observe. Students...
K20 LEARN
Considering "Charles": Pictograms, Annotations, Reading Strategies, And Multimodal Responses
Shirley Jackson's short story, "Charles," provides middle schoolers with an opportunity to practice their close reading skills. Using the provided list of prompts, scholars read and reread the story, then create a multimodal response to...
Curated OER
Getting There
Students practice reading a pictograph. In this data analysis lesson, students collect data and create their own pictograph. A students worksheet is included.
Curated OER
Use Information in Line, Bar, Circle, and Picture Graphs to Make Comparisons and Predictions
Eighth graders explore the concept of graphs. In this graphs instructional activity, 8th graders compare and contrast picture graphs, bar graphs, line graphs, and circle graphs. Students examine each type of graph and answer questions...
Curated OER
OUR FAVORITE BEARS
Students state bear facts aloud, practice counting the nuber of bears aloud on the picture graph, read the picture graph and answer questions aloud about the data on the picture graph, and draw a picture of their favorite bear.
Pennsylvania Department of Education
Months of the Year
Students develop a pictograph using the months of the year. In this months lesson, students place their name with their birth month on a large pictograph. They discuss the information they can see on the graph using the proper names for...
Curated OER
Hollywood's Top Ten
Students gather data on top 10 highest grossing movies, and make a bar graph and a pictogram.
Curated OER
Make a Paper Mache Bowl
Young scholars create a paper mache bowl. In this paper mache lesson, students use wallpaper paste, newspapers, and paint brushes to construct a paper mache bowl. Young scholars decorate their bowl with unique designs.
Growing Minds
Growing Minds: Cabbage Exploration
It's all about cabbage in this scientific observation resource! After reading a related story, learners explore three varieties of cabbage. They observe the leaves using a leaf diagram, predicting what the middle might look like. They...
Curated OER
Can You Measure Up?
Here is a well-designed lesson on common standards of measurement for your young mathematicians. In it, learners calculate measurements in standard and non-standard units. They make predictions, record data, and construct and design...
Curated OER
Design a Butterfly
Students access prior knowledge of butterflies. In this butterfly lesson plan, students create butterflies and compare and contrast their butterflies. Students describe the various body parts.
Curated OER
Does One Tree a Forest Make?
Students take a walk around the schoolyard looking at and identifying the trees. One leaf for each tree is collected. A chart is developed that represents the population of trees on the school ground. They keep journals and write an essay.


