Curated OER
Ice Cream Pictograph
Students create a graph. In this pictograph lesson, students cut out 20 small ice cream cones and decorate them. Students create a pictograph with their ice cream cones.
National Museum of the American Indian
Lone Dog's Winter Count: Keeping History Alive
What is oral tradition, and what unique tool did the Native Americans of the Northern Great Plains use to help them remember their complex histories? Through pictograph analysis, discussion, research, and an engaging hands-on activity,...
Curated OER
Gummy Bear Picture Graph
First graders investigate picture graphs. In this graphing lesson, 1st graders create a picture graph with the x-axis being number and the y-axis being color. Students sort their gummy bears by color and use pictures of colored bears...
Curated OER
Picture Fists Full of Kisses
Ease children's back-to-school jitters with this primary grade lesson based on the book The Kissing Hand by Ruth E. Harper. Starting off with a singing of the song "I Wish I Had a Little Red Box", children go on to discuss and...
Curated OER
Make a Pictograph
For this pictograph worksheet, 2nd graders create a pictograph involving colors they see the most often in clothing, recording marks and placing those marks in three boxes labeled red, blue and green. Students cut out squares for each 5...
National Security Agency
Line Plots: Frogs in Flight
Have a hopping good time teaching your class how to collect and graph data with this fun activity-based lesson series. Using the provided data taken from a frog jumping contest, children first work together...
Curated OER
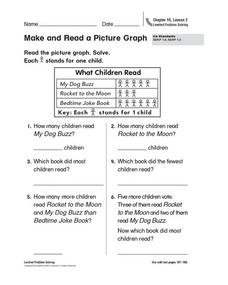
Make and Read a Picture Graph
What books do you like? Have your learners read and interpret a picture graph detailing a fictional class's favorite books. Consider conducting a survey of your learners' favorite books and plotting the results as a class!
Curated OER
Rubber Band Banza
Third graders review ideas about sound and vibration to make their own stringed instrument. They review what a pictograph and bar graph are. Pupils conduct a survey within the classroom to choose the four favorite string instruments and...
Curated OER
Survey Says...
Young learners create and implement a school-wide survey about student body favorites! Learners record and analyze the data on a bar graph, picture graph, and line graph, and then display the data. Then, wrap it all up with a celebration...
Curated OER
Lucky Charms Pictograph
Third graders create pictographs using a breakfast cereal. This fun, hands-on lesson plan allows students to use Lucky Charms cereal to create a pictograph. When the lesson plan is through, 3rd graders get to eat their Lucky Charms...
Curated OER
Classmate Pictograph
Learners create pictographs using their classmates in this technology-based lesson plan. The lesson plan uses Inspiration, or Kidspiration, digital cameras, and a downloadable pictograph template.
Curated OER
Rockin? Chalk (Integrating science - make own chalk)
Students use plaster of Paris, talc, and cornstarch to create their own chalk. They hypothesize what mixture of ingredients produce the "best" chalk. Students discuss what they think are the characteristics of the "best" chalk.
Curated OER
Creating and Reading a Pictograph
Second graders examine how data can be transferred into pictures on a pictograph. They analyze data on a graph about chewing gum, and create a pictograph that illustrates data about their preferences for the taste of bubble gum. ...
Curated OER
Petroglyphs and Pictographs
Fourth graders make necklaces out of petroglyphs that they stamp into clay. In this petroglyphs lesson plan, 4th graders draw designs and explain where they come from as well.
Curated OER
Creating Stories Using Pictographs
Students participate in diverse cultural activities that lead them to a better understanding of Native American people. They use pictographs to write a story, imagining themselves as tribal members. Students transfer their story to a...
Curated OER
Choose a Graph to Display Data
In this math graphs worksheet, students write line plot, tally chart, pictograph, or bar graph to tell the best kind of graph to use to answer the six questions.
Curated OER
Can You Count on Cans?
How can a canned food drive be connected to math? It's as simple as counting and organizing the cans! Children demonstrate their ability to sort non-perishable foods into categories that include soup cans, vegetable cans, boxed items,...
Curated OER
Graphing
Intended for a faith-based classroom, this lesson requires second graders to create a survey, conduct the survey in multiple classrooms, and graph the results. They can choose between creating a picture or bar graph, or you can require...
Virginia Department of Education
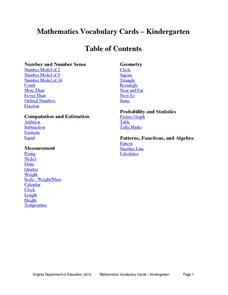
Mathematics Vocabulary Cards - Kindergarten
Enhance your math lesson with a series of pictures that illustrate different math concepts. The vocabulary includes a variety of ideas and pictures including fractions, ordinal numbers, picture graphs, and number lines.
Curated OER
Make a Graph
For this graphing worksheet, 1st graders use given data to create a graph and answer questions. In this problem solving worksheet, students solve five problems.
Curated OER
Birthday Graph
Students explore graphs. In this graphing math instructional activity, students record the birthdays of each classmate on a data table. Students cut out and add a picture of a birthday cake to a floor or wall pictograph...
Curated OER
M&M Graphing and Probability
Students sort, classify, and graph M & M's. They create pictographs and bar graphs with the colors and numbers in each bag of M & M's. They calculate the ratio and probability based on class results.
Curated OER
Jellybean Graphs
Second graders predict and graph data based on the color of jelly beans they think are in a handful. In this prediction lesson plan, 2nd graders will predict how many of each color jellybean are in a handful. Then they graph these...
Curated OER
Stone Soup
Students examine the topics of conflict, resolution, and solution using the book "Stone Soup." They create a class pictograph using real vegetables brought in by the students, answer story comprehension questions, and sequence the events...


