Curated OER
Picture Writing
Fourth graders create symbols. In this visual arts lesson, 4th graders study cave drawings, Native American pictographs, and Aboriginal Drawings prior to creating their own communication without using words.
Curated OER
SkittleGraphs
Second graders discover how to make a bar graph. Each student receives a bag of Skittles candy. They make a bar graph which documents the colors found in the bag. At the end of the lesson, the Skittles are eaten. Fun!
Curated OER
Sleep Central
First graders explore healthy and unhealthy sleeping habits. They make a class graph of the total number of hours students, as a class, sleep for the week.
Curated OER
Weather Report Chart
Students complete a weather report chart after studying weather patterns for a period of time. In this weather report instructional activity, students measure temperature, precipitation, cloud cover, wind speed, and wind direction for a...
Curated OER
Graphs Galore
Fourth graders conduct surveys to collect data. They analyze and interpret the data, then determine which type of graph is appropriate for the data. Students use the data to make predictions, discover patterns and draw conclusions...
Curated OER
First Day of Preschool
Learners discuss rules, have introductions, complete school tours, and more for the first day of preschool. For this first day of school lesson plan, students also discuss being good friends.
Curated OER
Graphing Fun In Third Grade
Third graders display information in a graph, table, and chart. In this data lesson plan, 3rd graders look at graphs, tables, and charts, discuss their importance, and make their own.
Curated OER
Rebus Treasure
Students explore the history of rebus puzzles. In this ancient history lesson, students discuss the history of rebus puzzles and collaborate to solve rebus puzzles.
Curated OER
Graphing Data
First graders learn how to display data using a bar graph. In this bar graph lesson, 1st graders use data from a t-shirt color survey to make a bar graph. They also make an animal bar graph before interpreting the information.
Curated OER
Practice Dividing by 8
In this dividing by 8 worksheet, students use the data in the math table to help them complete the pictograph chart on the right. Students use the pictograph to help them answer the six word problems.
Curated OER
Ojibwa Arts
Students create a poem based on the Native American Ojibwa art that they read about. In this Ojibwa art lesson plan, students read captions and look at pictures of Ojibwa art and then make up a poem based on them.
Curated OER
Reading Graphs
Students read graphs and charts to interpret results. In this algebra lesson, students interpret bar, line and pictographs. They draw conclusions and make predicitons based on these charts.
Curated OER
Range and Mode
Students interpret data from graphs. In this range and mode lesson, students review a tally chart, pictograph and bar graph. Students use these graphs to calculate the range and mode of each set of data.
Curated OER
Tally Time
Students create a tally chart. In this math and health lesson, students discuss healthy foods and create a tally chart showing the number of students who like to eat healthy foods.
Curated OER
Plastic Packaging
Students collect data. In this math instructional activity, students collect data about recyclable materials. Students develop a plan that will help the environment. Recycling plastic containers is discussed.
Curated OER
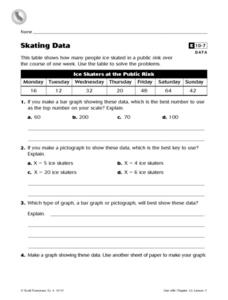
Skating Data
In this collecting data worksheet, 4th graders view a table on ice skaters at a public rink in order to answer 2 multiple choice questions, 1 short answer question and make a graph showing one piece of the data.
Curated OER
Paper Parachutes
Students participate in a simulation of a parachute-jump competition by making paper parachutes and then dropping them towards a target on the floor. They measure the distance from the point where the paper parachute lands compared to...
Curated OER
Balloon Jets
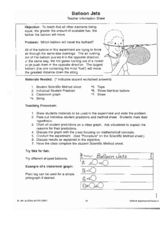
Students investigate how fuel amount affects the distance traveled by balloons. In this physics lesson, students collect data and create a pictograph. They interpret data and formulate a conclusion.
Curated OER
Halloween Graphitti
Students complete multi-curricular activities in a Halloween themed lesson. In this Halloween lesson, students examine newspaper ads to find prices of pumpkins and use them to complete a stem and leaf plot. Students find the diameter,...
Curated OER
Do Not Open Until May 2000!
Students create a time capsule. For this time capsule lesson, students collect and record data about themselves to be stored in a time capsule that will be opened at the end of the year.
Curated OER
Classification Introduction
Young scholars simulate classifying rocks using different colored skittles. For this earth science lesson, students create a Venn diagram according to their compiled information. They share this diagram in the class.
Curated OER
Candy Bar Survey
Second graders investigate the skill of graphing data by using candy bars to create context for the lesson. They use technology for graphing and organizing information like a spreadsheet. The lesson includes a resource link to aid in the...
Curated OER
Symbols Communicate Without Words
Students write different symbols we use in writing out in their word form. In this word symbols lesson plan, students practice writing out what the symbols represent. For example the symbol % stands for 'percent'.
Pennsylvania Department of Education
Up on Top
Students make bar graphs and identify items in the bar graphs as being likely, certain, or impossible. In this bar graphs lesson plan, students answer questions about the bar graphs using reasoning and communication skills.


