Curated OER
Traveling Through the Solar System
Learners use calculator and non-calculator methods for analyzing data. They apply data collection and analysis in a study of mass and weight. Students enhance and apply the concept of line of best fit. They master graphing in a plane,...
Curated OER
Measurement of Volume
Students measure the volume of a clear container using a candle and sand. In this measuring volume lesson plan, students time how long a candle stays lit in a clear glass container. They fill it with sand and find the volume and then use...
Curated OER
Probabilities for Number Cubes
Students explore the concept of probability. In this probability lesson, students roll a six-sided number cube and record the frequency of each outcome. Students graph their data using a frequency chart and keep tally marks in a...
Curated OER
What Are My Chances?
Students calculate probability. In this lesson on probability, students use given data to calculate to chances of a given event occurring. Many of the calculations in this lesson are applicable to daily life.
Curated OER
Moving Straight Ahead
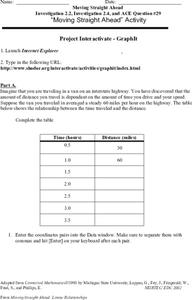
In this functions worksheet, 9th graders solve and complete 24 various types of problems. First, they complete the table with the correct distance for each hour given. Then, students enter the coordinate pairs into the function table...
Curated OER
Dealing with Data in Elementary School
Students follow the scientific method in collecting data. In this following the scientific method in collecting data lesson, students develop a question they would like answered such as how many aluminum cans are consumed each school...
Curated OER
Lines of Fit
Students graph an equation and analyze the data. In this algebra lesson, students graph scatter plots and identify the line of best fit using positive correlation, negative correlation an d no correlation. They apply their data analysis...
Curated OER
Solar Flares and Coronal Mass Ejections
In this solar flares and coronal mass ejections worksheet, students create a Venn Diagram with given data about solar flares and Halo CMEs. Students answer 6 questions about the events and the probability of each type of event occurring...
Curated OER
Oscillations
Students construct and compare the actions of various pendulums. In this pendulum motion lesson, students build and test different types of pendulums. They conduct experiments with the length of the swing arm and apply mathematical...
Curated OER
Analyzing Meteorological Data From Mars
Students compare real-time Earth and Mars measurements for temperature, wind speed, humidity and atmospheric pressure by accessing Internet-data resources from NASA. They access real-time weather data and maps for their school location.
Curated OER
Changes in Force, Motion, and Energy
Eighth graders construct various machines and compare the work done by them.
Curated OER
What Do We Do With A Dirty Bomb?
Students examine composition of dirty bomb and its possible effects on a city, and investigate simulations of such an event; students use computational and problem solving skills to assess damage and prepare report proposing solution to...
Curated OER
Bunny Cakes and Graphing
Third graders graph and analyze data relating to the book "Bunny Cakes" by Rosemary Wells. They listen to and discuss the book, vote on their favorite cake using Excel computer software, and discuss the results.
Curated OER
Probability and Geometry
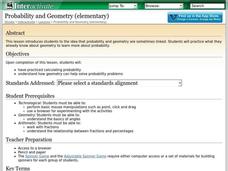
Students examine the relationship between probability and geometry to solve problems. In this geometry and probability lesson, students investigate the effect of changing percentages on a spinner to the probability of landing on a...
Curated OER
Who's got the fastest legs?
Students use a stopwatch to collect information for a scatterplot. In this fastest legs lessons, students collect data through the taking of measurements, create and find a median number. Students develop an equation and answer...
Curated OER
Jack and the Beanstalk Math
Students listen to Jack and the Beanstalk and determine what they think are the most common words. In this Jack and the Beanstalk lesson, students reread the story, count the words they chosen and graph those words. Students graph the...
Curated OER
Modeling Natural Disaster with Mathematical Functions
Ninth graders investigate the functional relationship of different environmental phenomena. In this math lesson, 9th graders create models of various natural disasters. They use logarithmic and exponential functions to interpret...
Curated OER
There's Gold in Them Thar Ratios
Students draw a model of the bunny problem which generates the Fibonacci Sequence, spirals generated from golden rectangles and golden triangles; identify the golden ratio in the human body, and find the Fibonacci numbers in nature.
Curated OER
Bow Wow, Oink Oink
Students read Everybody Cooks Rice and discuss birthday celebrations around the world. In this cultural differences lesson, students discuss the Chinese symbols by birth years. Students create a graph by symbol. Students display...
Curated OER
The Cube and Coin Challenges
Second graders participate in several games based on colored cubes and coins. They try to figure out the relative rate at which things happen and assess the concept of playing a fair game with their peers. Each student compare familiar...
Curated OER
Solving Logarithmic Equations
High schoolers solve logarithmic equations. They graph and plot logarithmic functions and use algebraic steps and the calculator to simplify and solve the equations.
Curated OER
ELECTRICITY 1
Fifth graders examine the importance of electricity to their everyday lives, practice plotting and interpreting data on a bar graph, and reflect in their journals about how their lives would change without electricity.
Curated OER
Move My Way: A CBR Analysis of Rates of Change
Learners match a given velocity graph and sketch the corresponding position graph using a graphing calculator. After collecting data from their everyday life, students use specific functions on their calculators to create graphs and...
Curated OER
The Geometry of Real Images
For this math worksheet, students read the examples for using the techniques of mathematical modeling. They draw the angles in order to simulate the reflection of light while using a concave mirror.
Other popular searches
- Reading Making Predictions
- Pictures Story Predictions
- Lesson on Making Predictions
- Reading Predictions
- Literary Predictions
- Predictions in Reading
- Predictions and Probability
- Making Predictions Worksheet
- Story Predictions
- Inferring Meaning Prediction
- Hurricane Prediction
- Prediction Science


