Novelinks
The View From Saturday: Concept/Vocabulary Analysis
Design your unit on The View From Saturday by E.L. Konigsburg with a concept and vocabulary analysis resource. It outlines the plot, literary elements, vocabulary issues, and any possible considerations for planning a differentiated...
Curated OER
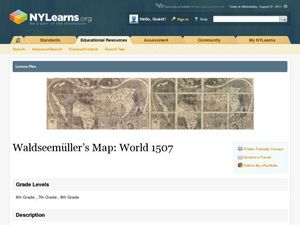
Waldseemüller’s Map: World 1507
Students take a closer look at historical maps. In this primary source analysis lesson, students examine the first world map produced by Martin Waldseemuller. Students complete the included map analysis worksheet and then write letters...
Curated OER
Maps and Modes, Finding a Mean Home on the Range
Fifth graders investigate data from maps to solve problems. In this data lesson, 5th graders study maps and collect data from each map. Students present their data in a variety of ways and calculate the mode, mean, median, and range.
Curated OER
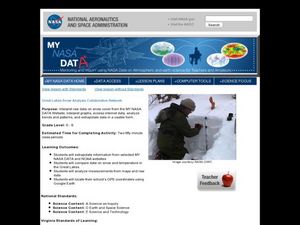
Great Lakes Snow Analysis Collaborative Network
Learners interpret data on snow cover and analyze trend patterns. In this snow instructional activity students compare data and locate their school's GPS coordinates.
Curated OER
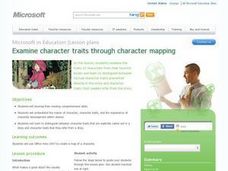
Examining Character Traits through Character Mapping
Some of what we know about a character is directly stated. Some of what we know is inferred by events in the story. Character maps help primary learners recognize the difference. After modeling with a story your class has read, pupils...
Curated OER
How Big is the Playground: Creating a Map
Young scholars create a topographical map of an area outside of the school. In this mapping lesson, students compile data on angles, distances, and key landmarks for a predetermined area on the school grounds to create a map using...
National Geographic
Mapping the Shape of Everest
With Mount Everest as the motivator, your earth science class learns about topographic maps. Begin by showing a film clip from The Wildest Dream: Conquest of Everest, featuring fearsome virtual imagery of a path up world's tallest peak....
University of Richmond
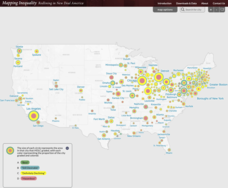
Mapping Inequality: Redlining in New Deal America 1935-1940
Redlining—or the practice of racial discrimination in housing loans—directly led to today's segregated living patterns in America. Using data from the federal Home Owners' Loan Corporation, classmates visualize the impact of policy on...
NASA
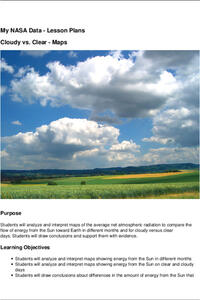
Cloudy vs. Clear - Maps
Find out the science of how clouds keep Earth cooler on hot days. Using guided discussions, investigators analyze and interpret maps of how much solar energy Earth receives at different times of the year. Participants draw conclusions...
National WWII Museum
What It Takes to Win: Mapping Primary Source Evidence
World War II was not just waged in Europe and Asia; the home front was key to Allied victory. Using newspaper clippings from World War II and a map, scholars plot out wartime production in the United States. After that, class members...
Curated OER
Mapping National and Geographic Identity
Students analyze geographic maps. In this map analysis lesson plan, students analyze the symbols in geographic maps and the impact of cultural, historical, and political concepts. Students compare and contrast maps in various mediums by...
Curated OER
Use Google Maps to Teach Math
Capture the engagement of young mathematicians with this upper-elementary math lesson on measuring time and distance. Using Google Maps, students first measure and compare the distance and time it takes to travel between different...
Curated OER
Size It Up: Map Skills
Compare information from a US population cartogram and a standard US map. Learners draw conclusions about population density by analyzing census data a population distribution. They discover that census data is used to apportion seats in...
Curated OER
Mapping Perceptions of China
Students discuss what types of things are included on a map. They compare and contrast maps of China with a map they create and practice using different types of maps. They write analysis of their classmates maps.
Curated OER
What Do Maps Show?: Lesson 1 Introduction to Maps
Learners brainstorm a list of the different types of maps they have seen or used. Using the activity sheet, they look through a social studies book to find all the maps and to determine what they are used for. Using a poster, they review...
Curated OER
Mapping My Spot in History
Students create their own town's history. They place themselves on the map in a literal as well as figurative sense. Students produce portions of an updated version of an early twentieth century panoramic map. Students gather information...
Curated OER
Written Document Analysis Worksheet
Investigate different types of documents with your middle schoolers. They look at newspapers, letters, maps, reports, etc. and answer a list of questions provided. Introduce them to different primary sources!
Curated OER
Assessing and Making Maps
Students evaluate maps using the TODALSIGs basic map analysis system, explained on the worksheet. They create a map of Alaska using TODALSIGs. Students brainstorm the elements of maps.
National Wildlife Federation
Get Your Techno On
Desert regions are hotter for multiple reasons; the lack of vegetation causes the sun's heat to go straight into the surface and the lack of moisture means none of the heat is being transferred into evaporation. This concept, and other...
Mathematics Assessment Project
Interpreting Distance–Time Graphs
Pre-algebra protégés critique a graph depicting Tom's trip to the bus stop. They work together to match descriptive cards to distance-time graph cards and data table cards, all of which are provided for you so you can make copies for...
Curated OER
Deep Convective Clouds
Young scholars observe clouds. In this deep convective clouds lesson, students analyze cloud data recorded over one month and draw conclusions based on results. Young scholars predict "Thunderstorm Season" and prepare to defend their...
Florida Center for Reading Research
Vocabulary: Word Analysis, Meaning Map
Lead young learners to understand new vocabulary with this series of word maps. The first of these organizers asks children to determine the definition and provide examples and descriptions of each word with the help of dictionaries,...
John F. Kennedy Presidential Library & Museum
Red States/Blue States: Mapping the Presidential Election
Young historians investigate how voting patterns have changed by comparing the outcome of the 1960 election to the outcome of the recent election. A creative final assessment has participants making a news show wherein they provide...
Curated OER
Grid Frame Mapping
Students map and describe small area of the schoolyard and discuss habitats.
Other popular searches
- Weather Map Analysis
- Gis Data Map
- Gus Data Map
- Map Data Layer
- Interpreting Map Data
- Interpret Ting Map Data
- Interpretting Map Data
- Gs Data Map


