Curated OER
Learning About the Basin
Learners use watershed maps to explore the Lake Pontchartrain Basin in Louisiana. In this geography lesson, students identify important features such as elevation, vegetation, cultural, historical and land use on a map of Lake...
Curated OER
A Bird's Eye View of our 50 States
Third graders focus on state birds as they learned absolute location (latitude/longitude) of each state, as well as their relative location (bordering states).
Curated OER
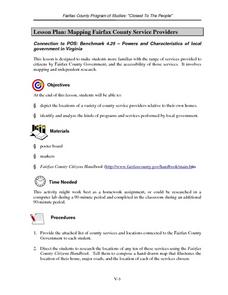
Mapping Fairfax County Service Providers
Learners brainstorm a list of services governments should have available to its citizens. Using the internet, they locate as many of these services as possible and compile a class list. They also analyze specific programs to consider...
Curated OER
THE TRAVELS OF BABAR: An Adventure in Scale : Integrating Visual Art and Social Studies
Pupils comprehend how the use of color impacts a work of art. They research how a theme can be rendered in a variety of ways (words, music, visuals). Students analyze how an artist's choices affect the aesthetic quality of artwork.
Curated OER
Country Mouse, City Mouse?
Students recognize the characteristics of a rural area. They analyze land use to determine whether the map is of a rural (country) area or an urban (city) area.
Curated OER
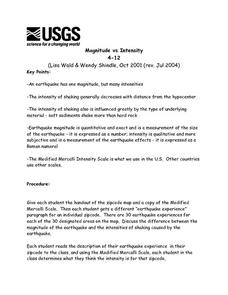
Magnitude vs Intensity
Learners use a zipcode map to locate earthquake experiences based on the Modified Mercalli Scale. They discuss the difference of the magnitude of an earthquake compared to the intensity of the shaking it causes.
Curated OER
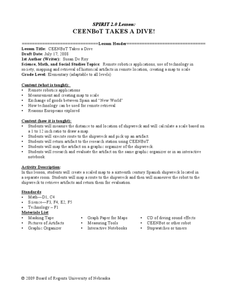
CEENBoT Takes a Dive
Learners create a map to scale using technology. In this algebra lesson, students navigate through a shipwreck to perform rescues. They use he CEENBoT program to perform the different tasks.
Curated OER
Soil Composition: Then and Now
Students identify the location of their school from a 1926 digitized Soil Sample map. Using remaining landforms, they determine the type of soil identified during that time, and compare it to the soil currently found near the school.
Curated OER
Introduction to the Planets
Students become familiar with the members of the solar system and planetary order. They identify differences and characteristics of individual planets. Finally students visualize the great size of the solar system and make the image more...
Curated OER
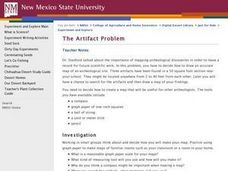
The Artifact Problem
Students work in small groups and make a map of a familiar room. For this artifact lesson, students decide on a suitable scale for their maps, the tools they will use and how they will make it and decide on strategies they would use to...
Curated OER
A Look at the Population Density of the United States
Middle schoolers acquire census information and create maps of the population density of the United States on different scales. They role play the roles of workers of a retail company and they use the population data to market to their...
Curated OER
Rosie's Walk
Students use maps and globes to locate and describe locations, directions and scale. Using the maps, they identify man made or natural features of different environments. They practice using geographical terms to describe a specific...
Curated OER
Dough Lake Topology
Students practice coordinates and measurements, develop 2D, 3D topological map, construct grid with string on real surface, establish "level" fixed point for measurements, take and record data points of elevation, and enter data on...
Curated OER
Plant Life of the Rainforest
Young scholars study pictures of tropical rainforests and discuss its stratified character. Students then work with a partner to make a scale drawing of the rainforest strata.
Curated OER
The Solar System
Students describe the different bodies that make up our solar system, explain the place of our solar system within the Milky Way Galaxy and the universe, explain day and night and the Earth's movement, and describe the relationship...
Curated OER
Evaluating an Illinois Earthquake
Learners examine the frequency of earthquakes in Illinois. They discover the distribution of earthquakes in the Midwest. They also practice reading measurements from the Richter scale and Mercalli Intensity scale.
Curated OER
Medieval Castles
Second graders design a scale model of a medieval castle and its surroundings including the following items: castle, moat, bailey, drawbridge, turrets, dungeon, grounds, and outer walls. A perfect lesson for those kids who are fascinated...
Curated OER
Ocean Currents
Fourth graders work in groups to research ocean currents and create posters with their findings. They locate the patterns and names of major ocean currents and identify them on a map. Students also use red pencil to show ocean currents...
Curated OER
Estimating Distances
Young scholars investigate distance measurement. In this middle school mathematics activity, students find the average length of their pace and use their pace to measure various unknown distances in feet and miles. Young...
Curated OER
GPS Art
Students design their own logo or picture and use a handheld GPS receiver to map it out. They write out a word or graphic on a field or playground, walk the path, and log GPS data. The results display their "art" on their GPS receiver...
Curated OER
Arctic Microclimates
Students identify, measure, and average micro-climatic temperatures in a particular region. They draw a small-scale map of an area to be sampled (classroom, playground, park, backyard) and identify potential locations for...
Curated OER
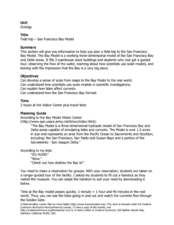
Field Trip - San Francisco Bay Model
Students investigate scale models while attending a field trip within the San Francisco Bay Area. In this oceanography lesson, students identify the currents of the Bay Area and discuss how they are created by different tides....
Curated OER
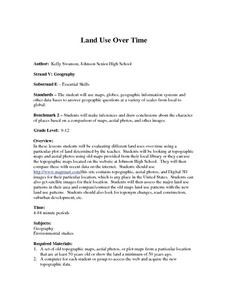
Land Use Over Time
Students view aerial photos and topographic maps of their local area. They compare and contrast major land use patterns over time by comparing these images to maps that are at least 50 years old. They analyze them using the four land use...
Curated OER
Development Issues in the Northern Suburbs
Students demonstrate the ability to obtain geographic information from a variety of print and electronic sources. They use a variety of maps and data to identify and locate geographical features of Minnesota and Anoka County. in...
Other popular searches
- Math Map Scales
- Using Map Scales
- Reading Map Scales
- Identify Map Scales
- Use Map Scales
- Geography Map Scales
- Comparing Map Scales
- Map Scales Conversion
- Geography Map Scales
- Making Map Scales
- Map Scales Lesson Plans
- Math Map Scales Problems


