Curated OER
World Statistic Day
Eleventh graders collect data about the state they live in. For this statistics lesson, 11th graders collect and analyze data as they compare themselves to students in other states. They analyze data about a person's education level, and...
Curated OER
Water Contamination Mapping Lab
Students are introduced briefly to the Biscayne Bay Ecosystem, observed microbe distributions and water current maps are introduced. They measure water current speeds to predict the movement of pollutants based on the type of the tidal...
Curated OER
Make Your Own "Weather" Map
Students create their own "weather" map using data from x-ray sources. They analyze and discuss why it is important to organize data in a fashion in which is easy to read. They compare and contrast different x-ray sources using a stellar...
Curated OER
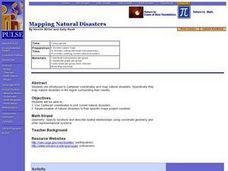
Mapping Natural Disasters
High schoolers use Cartesian coordinates to plot current natural disasters. They relate location of natural disasters to their specific major project countries. Students tie in geometry within this lesson as connected to spatial...
Curated OER
Water Quality and Watersheds: A GIS Investigation
Requiring more than one class period, this resource takes earth science learners on a journey through a watershed. Using ArcGIS Explorer, an online geographic information system, they view maps of watersheds and surrounding landscapes....
Curated OER
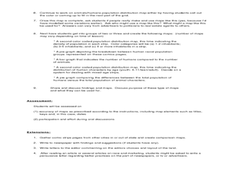
What is the Population Distribution of Cartoon Characters Living On the Pages of Your Newspaper?
Pupils read various cartoons in their local newspaper and calculate the population demographics, spatial distribution and grouping of the characters. Using this information, they create a population distribution map and share them with...
Curated OER
The Mekong River
Junior geographers explore the region through which the Mekong flows, its pathway, the landscape, how people depend on the Mekong, and future uncertainties. They apply the five themes of geography to examine the region. They create a...
Curated OER
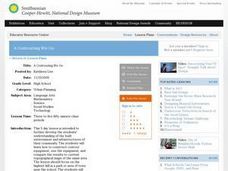
A Contouring We Go
Students examine the built environment and infrastructures of their community by constructing contour equipment, using the equipment, and comparing their results to current topographical maps of the same area
Curated OER
Take Me Out To the Ball Game
Students use a map to graph and locate major league teams of different sports. In groups, they analyze the population data of the United States and compare it with the amount and location of the major league teams. They share their...
Curated OER
Different Perspectives of Oregon's Forest Economic Geography
Pupils map data on employment in wood products manufacturing in Oregon counties. In this Oregon forest activity, students discover the percentage of people employed in the forest manufacturing industry. Pupils create a box and whisker...
Curated OER
Trouble in the Troposphere
Learners Use data sets from MY NASA DATA to produce graphs comparing monthly and yearly ozone averages of several U.S. cities. They analyze and evaluate the data and predict trends based on the data. In addition, they discuss and...
Curated OER
Trouble in the Troposphere
Middle schoolers create graphs using NASA data, compare ozone levels of several U.S. cities, analyze and evaluate the data and predict trends based on the data, and discuss and describe how human activities have modified Earth's air...
Curated OER
Traveling with Flat Stanley
young scholars use the internet to gather geographical data about a state of their choice. Using new vocabulary, they describe the features present in the state, its climate and attractions. They develop a PowerPoint presentation to...
Curated OER
Places and Production
Students calculate United States GDP and GDP per capita, use a choropleth map to acquire information, and create choropleth maps of GDP per capita in South America. They identify regions with high and low GDP per capita
Curated OER
Community Map of The Giver
Students read "The Giver" after finishing the unit on inventions and inventors. Using the information in the novel, they develop a geographic map illustrating the community in the story. They identify human and physical features and...
Curated OER
Using Maps To Make Public Health Decisions Case Study: Wildfires in Mexico 2000
Pupils study environmental health. Using actual NOAA satellite imagery, students investigate the basic concepts of mapping. They explore the relationship between monitoring satellite images and public health decision making.
Curated OER
U.S. History: What Happened Here?
Students apply the global positioning system to create maps of local historical sites. By collaborating with local historical groups, they research events and relate them to broader, national history. In addition to writing essays...
Curated OER
Where is Everybody?
Students collect data from different grade levels at their school and develop thematic maps which show population density, and determine how this might affect the school and themselves in the future.
Curated OER
Wow! You're Eating Geography
Students examine patterns of food producing areas, and identify foods that are grown locally, in the U.S., and around the world. They map and graph the major food crops of their local area, the U.S., and other countries, and discuss the...
Curated OER
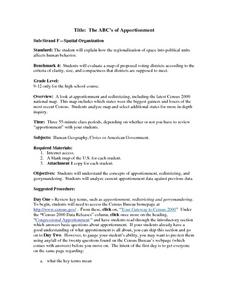
The ABC's of Apportionment
Young scholars are introduced to the terms of apportionment and redistricting. Using a Census map, they identify the states that had the highest and lowest numbers of change during the past ten years. They examine a map of voting...
Curated OER
Cruisin' the Counties: Learning Counties and Major Roads in Arizona
Learners examine Arizona counties and use the themes of location and movement to develop an Arizona map.
Curated OER
T-shirt Passport Lesson Plan
Students locate their t-shirt place/name on maps, then share facts/artifacts (souvenirs) from their place/name location orally with whole class. They create a database using information gathered from the whole class.
Curated OER
Fly on the Ceiling
Fourth graders play variety of games to help them explain coordinates.
Curated OER
Stream Gages and GIS
pupils interpret recent regional-scale climate events based on current stream flow, monitor changes in time, and to consider additional interpretations that could be derived if other data were in map form.


