Curated OER
Texting and Grades II
Given the least squares regression line, interpret the slope and intercept in the context of the relationship between texting and GPA. Although this task is short and looks simple, some subtle points can be brought to light in a...
Curated OER
8.SP.1Texting and Grades I
Here is a fitting question for middle schoolers to consider: Is there a relationship between grade point average and frequency of sending texts? Starting statisticians examine a scatter plot and discuss any patterns seen.
Spectrum
Grade 5 Standardized Test Prep
Here you'll find a great sampling of practice standardized test questions organized into four sections: ELA, mathematics, social studies, and science. Help your learners become familiar with the types of multiple-choice questions...
Houghton Mifflin Harcourt
Unit 3 Math Vocabulary Cards (Grade 3)
Looking for math vocabulary cards for third graders? Use a set of 15 math cards with terms associated with graphing. The top half of each sheet has the vocabulary word printed in bold text, and the bottom half includes...
K12 Reader
What’s Your Angle?
Start out with angles by asking your pupils to read this reading passage. Class members will learn about degrees, right angles, acute angles, and obtuse angles and then respond to five questions about the text.
Carstens Studios
Math Doodles
Discover the joy and excitement of improving your math fluency through four different puzzles. Combine those with 25 different ways to represent numbers and you have hours of enjoyment that can be fun outside of the classroom as well.
Curated OER
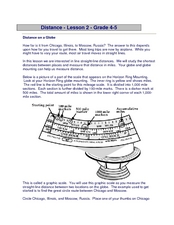
Distance on a Globe
In this world globe worksheet, students read a detailed one page text about how to measure distance on a globe. Students answer 5 questions that will require a globe.
Curated OER
Measuring the Lengths Using Rulers
Why are there so many lines on a ruler? Scholars measure length on two rulers, one standard and one metric. They measure in inches, millimeters, and centimeters with the centimeter measurement including a fraction. Because these are the...
Curated OER
Getting the Point!
Students explore the American cattle industry history. In this United States history and reading comprehension cross curriculum lesson, students read an article about the history of longhorn cattle, then answer comprehension questions on...
Curated OER
Problem Solving: Calendars
In this calendar learning exercise, students use a given set of calendars to answer 6 related questions. Houghton Mifflin text is referenced.
Curated OER
Congruence: Practice
In this congruence learning exercise, students trace figures, measure sides and angles, mark congruent sides and angles, then use a given diagram to answer questions and explain reasoning. Students also answer 2 test prep questions....
Curated OER
Histograms: Homework
In this histograms worksheet, students learn how to make a histogram. Students give graphs a title, draw the axes, label the vertical axis, choose an appropriate scale, and mark equal intervals. Students label the horizontal axis with...
Curated OER
Translate Patterns
In this math patterns learning exercise, students solve 6 problems in which the number, letter or shape pattern in a series is determined. Students mark the choice that shows how the pattern would be continued.
Mathed Up!
Spheres and Cones
Class members learn how to apply formulas for spheres and cones with a video that begins with a review of the formulas for surface area and volume of spheres and cones. Pupils use these formulas to solve problems on a worksheet.
Curated OER
Make a Bar Graph
In this bar graphs learning exercise, students use the tally chart to make a bar graph. Students color one box for each tally mark and then use the chart to help answer the questions about the sunny, cloudy, and rainy days.
Baylor College
Needs of Plants
What better way to learn about plant life than by creating a class garden? Young botanists start with a brief discussion about radishes before planting seeds and watching them grow. To determine the importance of water,...
Math Centre UK
Fractions—Basic Ideas
What are fractions? Find out using a reference page and video that goes in depth on how to make fractions equivalent, write fractions in simplest form, convert improper fractions into mixed numbers, and vice versa. Following...
Curated OER
Y-Intercept and Slope Intercept Form
Alegebra amateurs identify the slope and the y-intercept given a linear equation in slope-intercept form by correctly completing some in class problems. They write the linear equation in slope-intercept form that corresponds to the given...
Houghton Mifflin Harcourt
Customary Units of Capacity - Problem Solving 12.3
Math majors need not only to be able to solve problems, but also apply the skills to real-world situations. On this worksheet, they solve five problems in which they must convert units of capacity or liquid volume. Give this to your...
Curated OER
Sun and Shadows
Why do shadows look different in the summer than in the winter? What causes day and night? How can a sundial be used to tell time? Answer these questions and more through two engaging lessons about light and shadows. Fourth and fifth...
Curated OER
Finding the Flu
High schoolers work to determine when the flu is most prevalent in the United States. They gather data on their own, create calendar, charts, and graphs, analyze their findings and present them. This is a very appropriate winter lesson!
Curated OER
Three Dimensional Sketching
Students become familiar with drawing segments and points. They understand how perspective drawing differs from three dimensional sketching. They demonstrate three dimensional and perspective drawing.
Curated OER
Graphing
Intended for a faith-based classroom, this lesson requires second graders to create a survey, conduct the survey in multiple classrooms, and graph the results. They can choose between creating a picture or bar graph, or you can require...
Curated OER
Collect and Organize Data - Practice 14.1
In this data collection worksheet, students read the word problem and study the tally chart about favorite sports. Students then use the information in the chart to answer the questions. Students then use the list about students'...


