Hi, what do you want to do?
Curated OER
Reflections of a Linear Function
Students identify and reflect functions about the X-axis, Y-axis, and origin. They derive equations for reflected functions and graph the linear functions. Finally, students identify that f(x) can be reflected about each axis and the...
Curated OER
Algebraic Relationships
Here are 17 various forms of problems that range from matching equivalent expressions to word problems. Included are problems for substutiing values into expressions and using the order of operations, simplifying algebraic expressions,...
Curated OER
Whose Line is it Anyway?
Students solve systems of equations. In this algebra instructional activity, students identify the domain and range of each function. They use the slope and y-intercept to graph each line.
Curated OER
Find Minimum and Maximum
Learners engage in a lesson about finding the values of different graphs written in the vertex form. They rewrite each quadratic equation in vertex form while graphing the equation with the visual display of a parabola that matches the...
Mathematics Vision Project
Module 7: Modeling with Functions
The sky's the limit of what you create when combining functions! The module begins with a review of transformations of parent functions and then moves to combining different function types using addition, subtraction, and...
Curated OER
Discovering the Linear Relationship between Celsius and Fahrenheit
Middle schoolers discover the linear relationship between degrees Farenheit and degrees Celsius. They manually compute the slope and y-intercept of the line passing through points. They convert Celsius to Fahrenheit degrees.
Curated OER
Exploring Function Graphs
Tenth graders investigate three different sets of data that relate temperature to another variable in the physical world. These illustrate linear, inverse and exponential relationships.
Curated OER
Graphing Data from the Chemistry Laboratory
Students graph and analyze data using a spreadsheet.
EngageNY
Analyzing a Data Set
Through discussions and journaling, classmates determine methods to associate types of functions with data presented in a table. Small groups then work with examples and exercises to refine their methods and find functions that work...
Curated OER
What is a Solution to a System?
Learners define the solution to a system of equation. In this algebra lesson, students graph two line on the TI calculator and identify the point of intersection if there is any. They find one, zero or infinitely many solution and...
Curated OER
Slope Fields and Euler's Method
In this slope field worksheet, students use a slope field for a rate equation. Using Euler's Method, they identify the piecewise linear function approximating the solution of the initial value problem. This four-page worksheet contains...
Curated OER
Transformations and Exponential Functions
Tenth graders study graphing exponential functions. In this transformations instructional activity, 10th graders apply inquiry to determine how changes to a parent function affect its graph. Students analyze transformed graphs and...
Curated OER
Augmented Matrices
Pupils write systems of equations in an augmented matrix and enter it into their calculator. They use the reduced row echelon function on the calculator to solve the system of equations.
Curated OER
The Price Is Right
Students create a list of products with estimated prices. In this algebra lesson, students learn to write equations using variables. They match their created list with that of actual products and compare their prices,
Curated OER
Saving the Bald Eagle
Students plot on a coordinate plane. In this algebra lesson, students identify points on a coordinate plane and graph lines given coordinate pairs. They create a model as they study bald eagles and their growth and decay.
Curated OER
Chapter 1 and 2 Review
In this physics review learning exercise, students complete 24 matching and problem solving questions pertaining to math code, speed, experiments and variables, slope, and acceleration and average speed.
Curated OER
Confusing Colors!
Fourth graders collect data, graph their data, and then make predictions based upon their findings. They's interest is maintained by the interesting way the data is collected. The data collection experiment is from the psychology work of...
Curated OER
Review for the Algebra One SOLs
Students review the standards for Algebra I. Using the text, they discover two problems that match each standard and solve them showing all steps on paper. They create a PowerPoint slide for each problem and go through the correct...
Curated OER
Properties of Logarithms
Eleventh graders investigate logarithms. In this Algebra II instructional activity, 11th graders explore the properties of logarithms that are used to simplify expression and solve equations. Students confirm their...
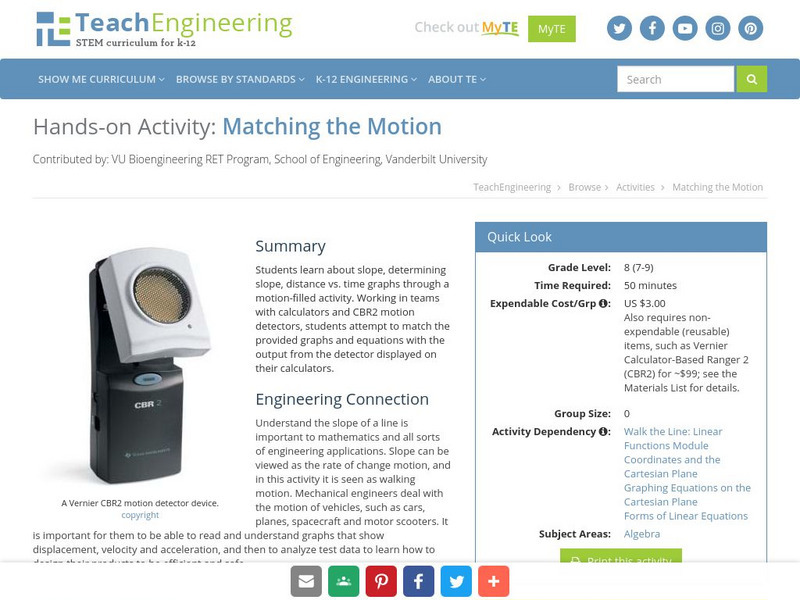
TeachEngineering
Teach Engineering: Matching the Motion
Students learn about slope, determining slope, distance vs. time graphs through a motion-filled activity. Working in teams with calculators and CBL motion detectors, students attempt to match the provided graphs and equations with the...
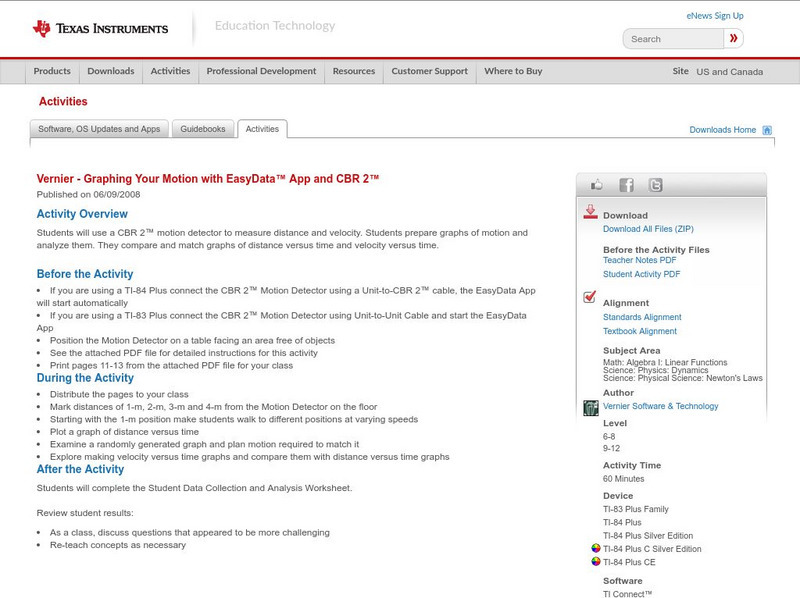
Texas Instruments
Texas Instruments: Graphing Your Motion With Easy Data App and Cbr 2
Students can use a CBR 2 motion detector to measure distance and velocity. Students prepare graphs of motion and analyze them. They compare and match graphs of distance versus time and velocity versus time.
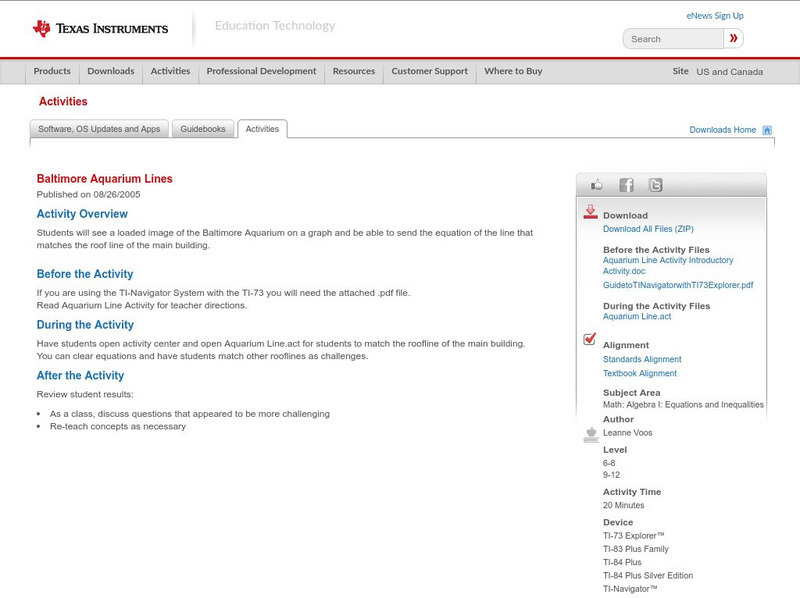
Texas Instruments
Texas Instruments: Baltimore Aquarium Lines
Students will see a loaded image of the Baltimore Aquarium on a graph and be able to send the equation of the line that matches the roof line of the main building.


