Curated OER
Budgeting for the Future
Eighth graders determine the net amount of an income for a fictional job. They must determine their net worth minus standard deductions. Students must then determine their monthly budget including, groceries, credit, and rent.
Curated OER
Probability Experiment Simulation: Design and Data Analysis Using a Graphing Calculator
Seventh graders simulate probability experiments. Using a graphing calculator, 7th graders design, conduct, and draw conclusions from simulations or probability experiments. Students construct frequency tables and compare the...
Curated OER
Graph Lesson
First graders collect data on different eye colors of each student in their classroom. They input the data that they gathered in an Excel spreadsheet and then create a graph in Excel.
Curated OER
Cover and Boarders
Students find the area and perimeter of rectangular figures. They use this information to find patterns and discover relationships between area and perimeter. Students apply and explain formulas relating to perimeter, area, and volume.
Curated OER
Adding And Subtracting Polynomials
Learners investigate the concept of adding and subtracting polynomials. They put terms in the correct order in order to solve them vertically. They simplify first with combining like terms and then conducting the calculations. The...
Curated OER
Area of Polygons
Students engage in a lesson that is about the concept of polygons and focuses upon finding the area. They use formulas provided in the lesson in order to solve problems given by the teacher for independent practice. Geometric figures are...
Curated OER
Projectiles
Students measure the angle and distance of an arc. For this projectile lesson, students observe arcs created by water guns, bow and arrows, and slingshots, then work in small groups and use protractors and strings to measure the angle...
Curated OER
Mosaic Tiles
I would consider this an outline and not a complete lesson plan. It would take a little work on your part because you would need to look on the internet for examples of Ojibwe art to show your pupils. They could explore the patterns that...
Curated OER
Kinzi Deaf Alumni
Students use data of school alumni to create a database. The lesson uses technology and access to a computer lab is essential. The concepts of graphing statistics is also used to help teach across the curriculum.
Curated OER
Problem Solving with the Wilderness Classroom
Students complete 45 multiple choice math word problems. For this math word problems lesson plan, students solve word problems on time, graphing, all four operations, money, and more.
Pennsylvania Department of Education
Multiplication Using Arrays
Explore the concept of multiplication by using arrays. Classmates use arrays to gain a better understanding of multiplication. They break arrays apart to model the distributive property of multiplication over addition. The relationship...
Pennsylvania Department of Education
The Multiplicative Identity and Numbers Close to One
Pupils practice multiplying and dividing whole numbers by fractions. They study the multiplicative identity property that states that the product of any number and 1 is that number. They multiply whole numbers by fractions close to 1 and...
Pennsylvania Department of Education
Fractional Parts Using an Area Model
Learners explore multiplying fractions and their relationship to parts of a whole. They draw and shade fractional parts to show parts of a whole and fractional parts of a fraction. Pupils also use an Internet site for interactive...
Out of Africa Wildlife Park
A Thematic Learning Guide to Lions
Written as an accompaniment to a field trip to the Out of Africa Wildlife Park in Arizona, this is an interdisciplinary, themed lesson on lions. Even if you cannot take your upper-elementary kids to this attraction, there are a few...
Mary Pope Osborne, Classroom Adventures Program
Mummies in the Morning Egyptian pyramids, hieroglyphics
Visit the Magic Treehouse and take your class on a trip through time with a reading of the children's book Mummies in the Morning. Using the story to spark an investigation into Egyptian culture, this literature unit engages...
Discovery Education
Mood Music!
Grouchy? Sad? Here's a great resource that shows kids how music can be used to lift their spirits. Kids collect and chart data on the effects of music on emotions. After analyzing the results of their experiment, they develop...
PwC Financial Literacy
Income and Careers: Career Exploration
Elementary schoolers take part in a virtual career day and are exposed to various career opportunities in the finance, education, and medical fields. By accessing a video you can download from the PwC Financial website, learners...
Northeast Georgia Regional Educational Service Agency
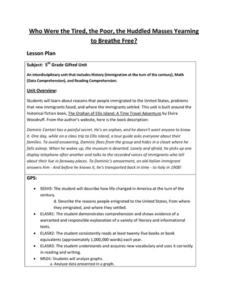
Who Were the Tired, the Poor, the Huddled Masses Yearning to Breathe Free?
Elvira Woodruff's The Orphan of Ellis Island: A Time Travel Adventure is the core text in a interdisciplinary unit study of immigration at the turn of the century.
Curated OER
A Picture is Worth a Thousand Words
Sixth graders work to write questions for a class survey. In this survey lesson, 6th graders survey their class members by asking the 4 questions they developed and will record their answers on the culminating assessment...
Curated OER
Number Stories 1: Student-generated Checklist
Students explore creating a self-assessment tool in a model classroom. Through the use of a video, students are observed engaging in peer assessment activities to generate a checklist. Students discuss the use of strategies a teacher can...
Curated OER
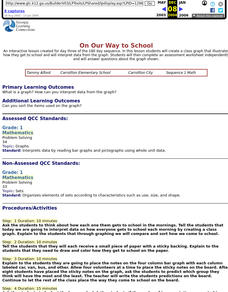
On Our Way to School
First graders create a class graph that illustrates how they get to school and interpret data from the graph. They complete an assessment worksheet independently and answer questions about the graph shown.
Curated OER
Comparing and Ordering Numbers
Students compare, order, and measure objects. In this measurement lesson, students are assessed on their ability to order, compare, and measure objects. This is an assessment only lesson and does not include instruction.
Curated OER
Interpreting and creating tables
Students observe examples and discuss how to interpret them. They then
brainstorm examples of possible questions students could use to create a table. They take time to formulate a question and collect data.
Curated OER
Graphing Fun
First graders analyze objects and make a graphing picture to analyze the data. In this graphing lesson, 1st graders complete an object graph assessment, a picture graph assessment, and a bar graph assessment to analyze their given objects.


