Curated OER
Graphing Data
Seventh graders solve and graph 10 different problems that include various questions related to data on a graph. First, they create bar graphs to display the data given. Then, pupils determine the random sample of a population listing...
Virginia Department of Education
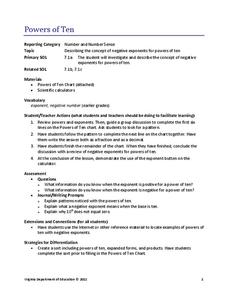
Powers of Ten
Investigate negative exponents of-ten. Pupils use the pattern of increasing powers of 10 to determine negative powers of 10. The scholars write the powers in expanded and product forms and make the connection to exponents using a...
Charleston School District
Graphing Functions
How do letters and numbers create a picture? Scholars learn to create input/output tables to graph functions. They graph both linear and nonlinear functions by creating tables and plotting points.
Charleston School District
Solving Systems Graphically
When guess and check gets old, it's time to start graphing! An instructive lesson explains how to solve a system of linear equations using graphing. Equations are in both slope-intercepts and standard form.
K12 Reader
Eratosthenes: Geographer and Mathematician
Mathematicians can be famous, too! Introduce your class to Eratosthenes with a reading passage. After they complete the passage, learners respond to five questions, some of which require opinions and others reading comprehension skills.
Curated OER
Coloring Multiples
In this coloring multiples activity, 3rd graders use game cards and hundreds chart (not included) to play a game, picking cards from 2-9 and coloring all multiples on the chart.
EngageNY
Creating Division Stories
Create your own adventure story ... well, not really. The fifth lesson in a 21-part series has pairs create story contexts for division problems. The lesson presents a step-by-step process for pupils to follow in writing such stories.
Curated OER
Comparing and Ordering Greater Numbers
Students line up the digits of the numbers they are comparing in the correct manner. In this comparing numbers lesson, students learn to line numbers up correctly on a place value chart before comparing them. Students then answer teacher...
Virginia Department of Education
Adding and Subtracting Fractions
Your learners will enjoy playing a game as a motivator to learning and remembering the adding and subtracting of fractions.
Virginia Department of Education
Road Trip
Help plan a road trip with linear equations. Scholars consider two different rental car companies and write equations representing the cost for each company. They graph the system of equations to determine the conditions under which each...
Virginia Department of Education
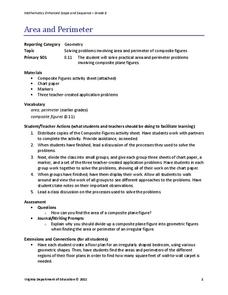
Area and Perimeter
Develop a strategy for finding the area and perimeter of irregular figures. Building on an understanding of finding area and perimeter of rectangles and triangles, learners apply the same concepts to composite figures. After practicing...
EngageNY
Least Common Multiple and Greatest Common Factor
Find the common denominator between prime factors, factor trees, and the distributive property. Scholars learn to find the least common multiple and greatest common factor of pairs of numbers. They rotate through stations to connect...
Curated OER
Comparing and Ordering Greater Numbers
Students compare and order greater numbers. In this place value lesson, students use a place-value chart to identify which set of numbers has the greatest value.
Curated OER
Fore!
In this golf worksheet, students fill in data in a chart about 6 tournaments and answer short answer questions about it. Students fill in 18 spaces in the chart and answer 2 questions.
Curated OER
Santa's List Sums (F1)
In this addition chart worksheet, 1st graders help Santa find the total number of boys and girls on the streets listed in the chart. Student find the sum of the boys and girls for the 17 streets.
Curated OER
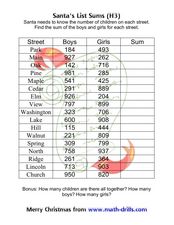
Santa's List Sums (H3)
In this addition chart worksheet, learners help Santa determine the number of children on the 17 streets listed in the chart. Students find the sums of the boys and girls by adding the numbers in the hundreds.
Curated OER
Santa's List Sums (F4)
In this addition chart worksheet, students help Santa find the number of children for the 17 streets. Students find the sum of the boys and girls on each street to complete the chart. Students add numbers in the thousands.
Curated OER
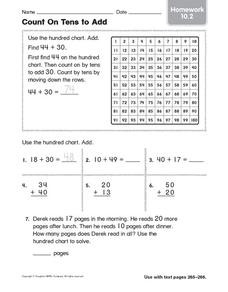
Count on Tens to Add: Homework
In this counting on tens worksheet, students use the hundreds chart to help add the problems. Students complete six addition problems and one word problem.
Curated OER
Five Minute Adding Frenzy (B)
In this addition review worksheet, students use their math skills to solve 100 problems that require them to find sums of the numbers in the columns and rows of the chart as quickly and accurately as possible.
Curated OER
Range and Mode
Students interpret data from graphs. In this range and mode lesson, students review a tally chart, pictograph and bar graph. Students use these graphs to calculate the range and mode of each set of data.
Curated OER
Analyze a Survey
In this analyzing data learning exercise, students read a tally chart regarding survey information and respond to 4 analytical questions regarding the data.
Curated OER
Working Out The Workout: Chart Activity
In this chart instructional activity, students complete one column in a chart to determine total hours of exercise time, then use the chart to complete 4 additional questions.
Curated OER
Mathematics In The Christmas Shoppe B
For this mathematics in The Christmas Shoppe B worksheet, students use the sales chart to answer 4 questions about sales at the shop.
Curated OER
Relating Coins to Bills: Enrichment
In this fractions and money worksheet, students use the chart that lists coins, their values, and the fraction they represent in a dollar. Students then use the chart to answer the questions.
Other popular searches
- Charts and Graphs Math
- Math Tally Charts
- Kwl Charts Math
- Place Value Chart Math
- Flow Chart Math
- Input Output Math Charts
- Math Flow Charts
- Math Charts
- Kl Charts Math
- Math Chart 1 1000
- Math T Charts
- 100 Chart Math Patterns


