Curated OER
Basic Algebra and Computers: Spreadsheets, Charts, and Simple Line Graphs
Students, while in the computer lab, assess how to use Microsoft Excel as a "graphing calculator." They view visual representations of line graphs in a Cartesian plane while incorporating basic skills for using Excel productively.
Newspaper Association of America
By the Numbers: Mathematical Connections in Newspapers for Middle-Grade Students
A cross-curricular resource teaches and reinforces mathematical concepts with several activities that use parts of a newspaper. Scholars use scavenger hunts to find the different ways math is used in the paper along with using data...
Curated OER
Create a Graph Online
Scholars create colorful bar, line, or pie graphs. They decide on a survey question to ask or a type of data to gather. From there, they collect information and data. They display this data in bar, line, or pie graphs that they create...
American Institutes for Research
Digital Smiles
Explore metric measurement, recording data, and creating an electronic spreadsheet displaying results with your math class. Scholars will measure the length of their smiles, record the measurements, and represent the results on an...
Curated OER
Then and Now
Students conduct research and use census data to compare different times and places. In this census activity, students interpret data from charts and graphs, comparing census information from two time periods as well as from two...
Curated OER
Party Math
Students create a spreadsheet that they will use to plan a small party or outing. They calculate expenses and stay within a budget amount for their party.
Curated OER
Graphing Using Excel
Fifth graders complete a series of graphs by gathering information and using Excel to graph the information. In this graphing lesson plan, 5th graders graph favorite desserts of the class. Student put their results into the computer and...
Curated OER
100 Stamps for 100 Days
Students recognize similarities and generalize patterns. In this math and technology lesson plan, students develop an understanding of number patterning by grouping stamps and counting by 10s.
Curated OER
Countdown to Disaster
Students discover the potential dangers of weather in their hometown. In this environmental lesson, students research Hurricane Hugo and the devastation it caused South Carolina in 1989. Students record weather data from their city and...
Curated OER
M&M Graphing
Fourth graders name colors of M&Ms and record answers. They estimate number of M&Ms of each color found in a typical package of M&Ms on piece of paper.They record information on sheet of paper and create a spreadsheet. paper.
Neufeld Learning Systems
Concept: Ratios and Proportions
Upper elementary and middle school pupils fill out a chart creating six equivalent fractions and then compare them to six different objects and/or shapes. They group together 16 various terms related to ratios and proportions. Pupils...
Curated OER
Graphing on the Computer
Students create a bar graph on the computer using given information from the teacher. They create a bar graph using their own information chart (they need to create one on separate paper first). They utilize Microsoft Excel for this lesson.
Curated OER
Electronic Spreadsheets & Iditarod 2000
Students use the Internet for gathering information for Iditarod race journals. They use a spreadsheet program for entering data and making charts for showing changes in speeds achieved over a period of four weeks in timed writings in...
Curated OER
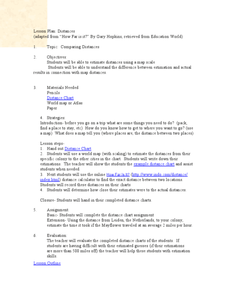
Comparing Distances
Learners practice estimating distances by analyzing a map. In this length measurement lesson, students view a map with a distance key and use their measurement skills to estimate the distance between two cities. Learners utilize an...
Curated OER
Great Graphing
Young scholars collect data, use a computer spreadsheet program to create various graphs, and compare the graphs. They state the findings of each graph in writing and decide which graph type best represents the data.
Curated OER
EXCEL It!
Students surf the Web gathering information about graphs. The data collected is incorporated into an Excel spreadsheet and graphs of varying nature generated to further enhance student understanding.
Curated OER
Data! Data! Graph that Data!
Fifth graders create data graphs using Microsoft Excel. For this data collection lesson, 5th graders create and conduct a survey, then use Excel to organize and graph their data.
Curated OER
Excel temperature Graphs
Learners gather data about the weather in Nome, Alaska. In this Nome Temperature lesson, students create an excel graph to explore the weather trends in Nome. Learners will find the average weather and add a trend line to their graph.
Curated OER
Migration of the Neo-Tropical Songbirds
Fifth graders plot the migration of birds using Google Earth. In this lesson on bird migration, 5th graders work in groups to plot the migration of a group of birds using Google Earth. Students present and discuss their findings and look...
Curated OER
Graphing With Candy
Students gather information and interpret the results using a tally chart, a table, and a bar graph.
Curated OER
Equadorian Rainforest: The Tropical Supermarket
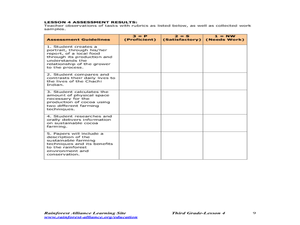
Young scholars study the concept of sustainable agricultural practices through cocoa farming and the lives of the people who are the producers. Students watch a slide show and read a story which helps them understand the origins of...
Curated OER
How many seeds?
Students investigate seeds and find the difference between seeds and nuts. In this seeds and nuts lesson, students predict, then count the number of seeds in an apple. Students record and share their results. Students compare seeds to...
Curated OER
Patterns Here, There, and Everywhere!
Upper graders access the Microsoft Word program and create patterns by utilizing certain keys on the keyboard. They create picket fences, smiley faces, and hearts. It seems that this lesson has as much to do with keyboarding skills as it...
Curated OER
Graphing Family Reading Habits
Second graders collect data from their families about their reading habits and graph them. In this graphing family reading habits lesson, 2nd graders interview family members about their reading habits. They then use a graphing computer...
Other popular searches
- Charts and Graphs Math
- Kwl Charts Math
- Input Output Math Charts
- Kl Charts Math
- T Charts in Math
- Kl Charts Math 6th
- Kwl Charts Math 6th
- Free Math Charts
- Input/output Math Charts
- Kwl Charts Math Lesson
- Math Charts Graphs
- Reading Math Charts


