Curated OER
Bar and Histograms (What Would You Use: Part 1)
Students practice creating bar graphs using a given set of data. Using the same data, they create a group frequency chart and histograms. They must decide the best graph for the given set of data. They share their graphs with the...
Curated OER
Ice Cream Scoop
In this data display learning exercise, students write 6 flavors of ice cream on pieces of paper. Students choose papers one at a time and keep track on a tally sheet. Students make a bar graph of the results.
Curated OER
A Look at Race in America Using Statistics
Eleventh graders explore the issue of racism in America. In this American History instructional activity, 11th graders analyze charts and graphs on blacks and whites in America.
Curated OER
Math Review
In this math review worksheet, learners complete 40 assorted problems pertaining to counting money (in English pence), addition and subtraction, divisibility, and milometer (odometer) word problems.
Curated OER
What Percentage of Time Do You Spend Doing Daily Activities?
Engage your kids with an intriguing, real-life exploration that covers several areas in math, and allows for natural academic differentiation.
Curated OER
Survey Say...
Students examine a variety of charts and graphs that present data in a format that is easy to read. They work in groups to conduct a survey amongst their classmates. The data collected from the survey is then put on a bar graph.
Curated OER
Count The Letters
Students perform activities involving ratios, proportions and percents. Given a newspaper article, groups of students count the number of letters in a given area. They use calculators and data collected to construct a pie chart and bar...
Curated OER
Paying for Crime
Learners participate in activties examining ratios and proportions. They use graphs to interpret data showing the government's budget for prisons. They present what they have learned to the class.
Curated OER
Dealing With Data
Students collect, organize, and display data using a bar graph, line graph, pie graph, or picture graph. They write a summary describing the data represented and compare the graph to another graph in the class.
Curated OER
Tally Time
Students create a tally chart. In this math and health activity, students discuss healthy foods and create a tally chart showing the number of students who like to eat healthy foods.
Curated OER
Tracking the Wild Ones
Students apply mathematic skills to discover the extent of the concern for endangered species. Students analyze graphs and look for trends in graphed results of endangered species on a global level.
Curated OER
How do We Treat Our Environment?
Seventh graders explore the concept of collecting data. In this data collection lesson, 7th graders survey others about their environmental habits. Students graph their data.
Curated OER
Diagnosing Allergies Through Data Collection
Students research and organize information about allergies. In this data collection lesson, students watch a video about allergies. Students create a histogram using the information collected. Students complete the 'Displaying Survey...
Curated OER
Building Towers with Number Cubes
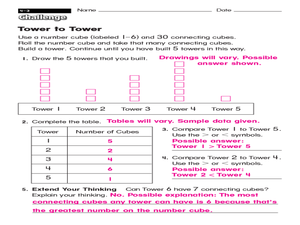
In this building towers with number cubes worksheet, 2nd graders build number cube towers by rolling a dice, then complete a data chart to compare the number of cubes in each tower.
Curated OER
Countdown to Disaster
Students discover the potential dangers of weather in their hometown. In this environmental lesson, students research Hurricane Hugo and the devastation it caused South Carolina in 1989. Students record weather data from...
Curated OER
Problem Solving and Puzzles: 3
Your class can use this to warm up or to discuss their problem solving strategies. They review the 8's times tables, relate the multiplication problems to division, then use a chart to solve a word problem involving money.
Curated OER
Probability Fun
What are the chances? Probability comes into play in this worksheet as mathematicians examine a circular chart with images, determining the possibility that the "spinner" will land on each of the images. Appropriate for younger...
Curated OER
What Color Are Your Eyes?
In this color of eyes worksheet, students conduct a survey to determine the number of students who have brown, hazel, blue or green eyes. The information is collected and then the data is organized. Students may use the data to create...
Curated OER
What Are Your Favorite Apples?
In this tally instructional activity, students take a survey to determine the favorite apple. They write tally marks beside the apple chosen. For elementary students, this instructional activity may be used for counting purposes and to...
Curated OER
Bones and Math
students identify and explore the connection between math and the bones of the human body. Students collect data about bones from their classmates and from adults, apply formulas that relate this data to a person's height, and organize...
Curated OER
Santa's List Sums
In this Christmas math worksheet, students help Santa find the number of children on each street by adding the sum of boys and girls listed in the chart. Students solve 17 problems.
Curated OER
Santa's List Sums (12)
In this Christmas math worksheet, learners help Santa find the number of children on the 17 streets by adding the number of boys and girls in each line of the chart.
Curated OER
Dynamite Data
Second graders rotate through a variety of stations designed to offer practice in manipulating data. They sort, tally and count items and then create bar graphs, tables, and pie graphs to record their findings.
Curated OER
Show Me!
Students analyze and interpret graphs. In this graphing instructional activity, students view a video and construct their own graphs (line, circle, bar) from given sets of data.


