Curated OER
Color the Shapes in the Crown
In this geometric shapes worksheet, students analyze a picture of a crown. Students look for the circles, diamonds and rectangles and color them according to the key.
Curated OER
Cube: Print and Color
In this word recognition worksheet, students trace the word "cube", write the word independently, and color the picture of the shape
Curated OER
Eight: Print and Color
For this word recognition worksheet, students trace the word "eight", write the word independently, and color the picture of the eight.
Curated OER
Number 6: trace and color
In this number 6 worksheet, students trace the number 6 and color 6 different Dora the Explorer characters. Students trace the number 6, 5 times on this worksheet.
Curated OER
Color the Odd One Out
In this odd one out activity, students will look at a row of 4 fish and color the fish that does not match the others. There are a total of 5 rows of fish.
Math Drills
Thanksgiving Cartesian Art: Pilgrim Hat
What did some Pilgrims wear on top of their heads? Individuals graph sets of ordered pairs, and connect the points to create a mystery Thanksgiving picture.
Math Drills
Thanksgiving Cartesian Art: Mayflower
How did the Pilgrims arrive to America? Middle schoolers graph ordered pairs on a coordinate system, connect the points, and discover a mystery picture—the Mayflower.
EngageNY
Mixture Problems
What percent of the mixture is juice? Pairs use their knowledge of proportions to determine what percent a mixture is juice given the percent of juice in the components. Pupils use the procedure learned with the juice mixture problem to...
Math Drills
Thanksgiving Cartesian Art: Pumpkin
Not a Halloween jack-o-lantern, but a Thanksgiving pumpkin! Young mathematicians graph and connect points on a coordinate system to unveil the mystery picture.
Math Drills
Halloween Cartesian Art
Jack-o-lanterns are the face of Halloween. Middle school mathematicians graph coordinates on a cartesian plane and connect the points to create a jack-o-lantern.
Curated OER
Sorting Sweethearts
In this holiday worksheet, students estimate how many heart candies are in a cup. Then, students sort their hearts and add up how many are in each color and how many there are total. Students also create a bar graph that displays how...
Curated OER
Easter Graphing Fun
Graphing can be festive! This Easter activity has scholars using coordinates to record the location of ten holiday images. The first is done for them, and the grid is large and appealing to younger learners. Consider visualizing this...
EngageNY
The Line Joining Two Distinct Points of the Graph y=mx+b Has Slope m
Investigate the relationship between the slope-intercept form and the slope of the graph. The lesson plan leads an investigation of the slope-intercept equation of a line and its slope. Pupils realize the slope is the same as the...
EngageNY
The Graph of a Linear Equation—Horizontal and Vertical Lines
Graph linear equations in standard form with one coefficient equal to zero. The lesson plan reviews graphing lines in standard form and moves to having y-coefficient zero. Pupils determine the orientation of the line and, through a...
EngageNY
Chance Experiments with Outcomes That Are Not Equally Likely
The fifth portion of the 25-part series introduces probabilities calculated from outcomes that are not equally likely. Class members use tables to calculate probabilities of events, add outcome's probabilities, and find...
EngageNY
Solving Problems by Finding Equivalent Ratios II
Changing ratios make for interesting problems. Pupils solve problems that involve ratios between two quantities that change. Groups use tape diagrams to represent and solve classroom exercises and share their solutions.
EngageNY
The Structure of Ratio Tables—Additive and Multiplicative
Build tables by understanding their structure. Scholars take a closer look at the structure of ratio tables in the 10th segment in a 29-part series. Individuals realize that the tables can be built using an additive or...
EngageNY
Tables of Equivalent Ratios
Don't table the discussion on equivalent ratios — do it now! Scholars create tables of equivalent ratios to represent contextual problems. Pupils go on to use the tables to answer questions within the context. The lesson is ninth in a...
Math Drills
Halloween Cartesian Art: Witch Hat
What is the mystery picture? After plotting points on the first quadrant of a Cartesian coordinate system, young mathematicians connect the points to create a Halloween-themed picture.
Curated OER
Rectangles and Shapes
A rectangles and shapes online worksheet in which young learners determine what fraction is shaded in eight rectangles. They also answer three word problems and color the parts shown and requested on five shapes. They get immediate...
Curated OER
Recognizing the Number 2
In this number 2 worksheet, students color the large number 2, trace the number 2 four times and then circle the groups with 2 items in them at the bottom of the worksheet.
Curated OER
Q Is For Quilt
In this letter Q worksheet, young scholars trace and practice examples of upper and lower case letter Qq. Students color a large quilt pattern and notice the geometric shapes.
Curated OER
Count the Images!
Based on a selection of images, learners create a bar graph depicting how many of each image is shown. There are two graphs, each with three images to chart. After they are finished, scholars can analyze the data and draw conclusions. To...
NEST Family Learning
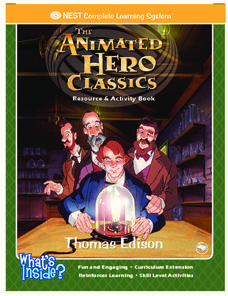
Thomas Edison: Resource and Activity Book
What other inventions was Thomas Edison responsible for besides the telegraph and lightbulb? Incorporate a set of worksheets into your study of Edison and other inventors. The 48-page packet includes all types of activities from word...
Other popular searches
- Coloring Math
- Math Coloring Sheets
- Coloring Math Activity
- Map Coloring Math
- Math Coloring Worksheets
- Coloring Math Generator
- Christmas Coloring Math
- Math Coloring Pages
- Code Math Coloring
- Spring Coloring Sheets Math
- Math Coloring Puzzles
- Math Coloring Multiplication


