Willow Tree
Line Graphs
Some data just doesn't follow a straight path. Learners use line graphs to represent data that changes over time. They use the graphs to analyze the data and make conclusions.
Mathematics Assessment Project
Classifying Equations of Parallel and Perpendicular Lines
Parallel parking might be difficult, but finding parallel lines is fairly simple. In this lesson, learners first complete an assessment task involving parallel and perpendicular lines in the coordinate plane. Individuals then take part...
University of Nottingham
Modeling Conditional Probabilities: 2
Bring the concept of conditional probability alive by allowing your classes to explore different probability scenarios. Many tasks have multiple solutions that encourage students to continue exploring their problems even after a solution...
Curated OER
Parabolas
Students investigate parabolas and their equations. In this parabolas and their equations lesson, students graph quadratic equations on their graphing calculator. Students find the axis of symmetry of a parabola. Students discuss the...
Curated OER
The Apple Orchard Problem
Students explore various approaches to solving a problem of maximizing the total production of apples in an orchard. In this apple orchard lesson, students collect data in order to solve the apple orchard problem presented. Students plot...
Curated OER
Complex Fractions
In this algebra worksheet, students divide complex fractions using properties of division and reciprocals. They are to get rid of all negative exponents. There are 48 problems.
Curated OER
Introduction to Tangent Lines using the TI-Nspire
Learners make mathematical argument using the concept of Limit. In this algebra lesson, student calculate the instantaneous rate of change from the linear graph. They use a TI-calculator to create a visual of the graphs.
Curated OER
Linear and Exponential Models
Learners linearize data to determine if an exponential model is suitable. In this linearizing data to determine if an exponential model is suitable lesson, students graph the residuals of sets of data that appear to have an exponential...
Curated OER
Multiplying and Dividing Rational Expressions
In this college level worksheet, students multiply and divided rational expressions and simplify the answers. The two page worksheet contains sixty-two problems. Answers are provided.
Curated OER
Slope
Students calculate the slope of a line. In this slope lesson plan, students use a graph, an equation or two points to help them calculate the slope of a line. They differentiate between a slope of zero and an undefined slope.
Curated OER
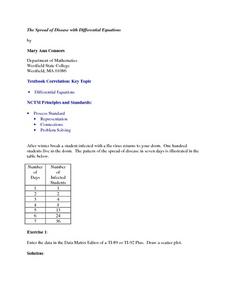
The Spread of Disease with Differential Equations
Twelfth graders solve problems using differential equations. In this Calculus lesson, 12th graders analyze data regarding the spread of a flu virus. Students use the symbolic capacity of the TI-89 to develop a model and analyze the...
Curated OER
River Optimization Problem
Students define the different methods used for optimizing a particular element of a problem. In this optimization problem lesson, students optimize appropriate details of a problem using data collection, algebra, technology, and/or...
Curated OER
Sequence Investigation
Eleventh graders investigate arithmetic sequences. In this Algebra II lesson, 11th graders create an arithmetic sequence and explore the effect of each variable in the formula of the nth term of an arithmetic sequence. Students graph...
Curated OER
Direct, Inverse and Joint Variation
Eleventh graders identify, create and solve word problems involving inverse variation. In this algebra lesson, 11th graders solve problems using direct, inverse and joint variation. They identify problems using these methods.
Curated OER
Chart Your Course
Students explore change represented in graphs comparing distance and time. They exchange and share their graphs. Students interpret and create distance versus time line-graphs, and write stories based on these graphs. They interpret a...
Curated OER
Jambalaya's Restaurant
Young scholars use a menu and recipes to work on adding, subtracting, and percentages. They are given they weekly circulators, advertisements, or actual products and students practice figuring out sales tax. Young scholars figure slaes...
Curated OER
Charts and Graphs
Fifth graders interpret data into graphs and percentages. In this organizing data lesson, 5th graders discuss bar, circle and line graphs. Students complete bar graph and apply probability using the results.
Curated OER
Exercise Set 3.3: Laws of Logarithms
For this logarithms worksheet, students simplify and solve 100 logarithm problems. Students use logarithem rules to prove logarithm properties and simplify logarithmic expressions.
Curated OER
WINDMILL POWER
Students study operations with real numbers using mental computation or paper-and-pencil calculations. They judge the reasonableness of numerical computations and their results. They set up and solve proportions for direct and inverse...
Curated OER
NEXT GENERATION SPACECRAFT-Orion
Students investigate the volume of a solid. In this calculus instructional activity, students use integration to find the volume of a solid generated by a region, the Orion crew module.
Curated OER
Excel Lesson
Students investigate Microsoft excel. In this technology lesson, students create formulas using excel and apply these formulas to solve relative, absolute and mixed reference cells. They perform immediate and delayed calculations.
Curated OER
Basketball Bounces, Assessment Variation 2
This un-scaffold summative assessment tasks learners to use the height of a bouncing basketball, given the data in graph and table form, to choose the model that is represented. Learners then use the model to answer questions about the...
Curated OER
Throwing Horseshoes
Collaborative learners interpret a quadratic expression written in different forms in this task centered on throwing horseshoes.
Curated OER
Snail Invasion
Exponential growth is modeled by learners as they analyze and interpret the data presented in this real-life scenario centered on the destructive invasion of the Giant African Land Snail. Learners get a touch of history and practice...
Other popular searches
- Math Functions Quadratic
- Math Functions Domain Range
- In/out Math Functions
- Math Functions and Patterns
- Math Functions Egg Carton
- Math Functions Spaghetti
- Math Functions Bridge
- Math Functions Rounding
- Composite of Math Functions
- Math Functions Quadractic
- Functions Math
- Linear Functions Math Models


