Curated OER
Graphing Inequalities
Learners solve inequalities and graph. In this algebra lesson, students rewrite inequalities in the slope intercept form and graph using the slope and intercept. They shade the correct side of the line using greater than or less than as...
Curated OER
Linear Graph
Students solve linear equations and graph the different functions. In this algebra lesson, students graph piecewise functions using the slope and y-intercept and the given restrictions on the domain of the line. They discuss rate of...
Math Mammoth
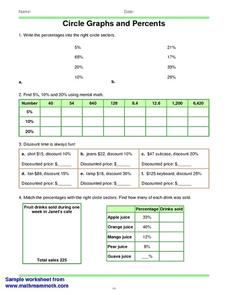
Circles Graphs and Percents
In this percent instructional activity, students read and interpret circle graphs. They determine discounts, and match percentages with circle sectors. This one-page instructional activity contains approximately 30 problems.
Curated OER
Going Bananas: Addition and Graphing
In this addition worksheet, 1st graders will look at a picture to add the total number of bananas a monkey eats per day for five daily sums. Then students will answer four short word problems which require students to view the data as a...
Curated OER
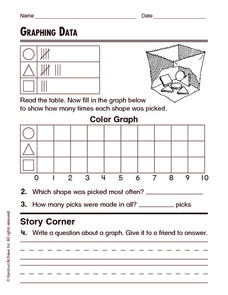
Graphing Data
In this graphing data worksheet, students solve and complete 8 different word problems related to graphing data given. First, they determine the percent of people who do not believe in any of the phenomena described and explain. Then,...
Inside Mathematics
Population
Population density, it is not all that it is plotted to be. Pupils analyze a scatter plot of population versus area for some of the states in the US. The class members respond to eight questions about the graph, specific points and...
Texas Instruments
Math TODAY for TI-Navigator System - Is Leisure Time Really Shrinking?
High schoolers organize data from the USA TODAY Snapshot, "Is leisure time really shrinking?" into two scatter plots and determine the quadratic model for each scatter plot. They determine if these graphs intersect and learn the concept...
Mathematics Vision Project
Systems of Equations and Inequalities
It's raining (systems of) cats and dogs! The fifth unit in a nine-part course presents systems of equations and inequalities within the context of pets. Scholars use systems of inequalities to represent constraints within situations...
Charleston School District
Sketching a Piecewise Function
How do you combine linear and nonlinear functions? You piece them together! The lesson begins by analyzing given linear piecewise functions and then introduces nonlinear parts. Then the process is reversed to create graphs from given...
EngageNY
Multi-Step Problems in the Real World
Connect graphs, equations, and tables for real-world problems. Young mathematicians analyze relationships to identify independent and dependent variables. These identifications help create tables and graphs for each situation.
Curated OER
Sunshine Math--3: Mars, II
Students practice solving mathematical word problems. In this math worksheet, they solve one probability problem, write in the missing numbers in a table, solve one mental math problem and interpret two graphs.
Curated OER
Sunshine Math- 1 Venus, III
In this problem solving worksheet, students complete 7 problems that include: reasoning, basic operations, graphs, tables, geometry and math puzzles.
Curated OER
Sunshine Math- 5 Saturn, VI
In this math applications worksheet, students solve 8 problems pertaining to probability, patterns, coins, order of operations, graphs and equations.
Curated OER
Sunshine Math- 2 Earth, VII
In this math worksheet, students solve 8 varied problems that include: making tables, circle graphs, choosing the sign, finding angles in pictures, and estimation.
Curated OER
Sunshine Math- 2 Earth, XIII
In this problem solving instructional activity, students complete 7 problems that include skills in probability, addition, even and odd numbers, reasoning and graphs.
Charleston School District
Increasing, Decreasing, Max, and Min
Roller coaster cars traveling along a graph create quite a story! The lesson analyzes both linear and non-linear graphs. Learners determine the intervals that a graph is increasing and/or decreasing and to locate maximum and/or...
US Department of Commerce
Immigration Nation
People come and people go. Given tabular census data on the annual number of immigrants from four different regions of the world between 2000 and 2010, pupils create double bar graphs and line graphs from the data. They analyze their...
Cornell University
Math Is Malleable?
Learn about polymers while playing with shrinky dinks. Young scholars create a shrinky dink design, bake it, and then record the area, volume, and thickness over time. They model the data using a graph and highlight the key features of...
Curated OER
Who Wants to Win Millions?
What a terrific way to have learners practice reading graphs. Using visually appealing graphics, they answer questions about birds, hours in a work week, and the amount of fruit bought. The graphs are attractive and easy to understand.
Concord Consortium
Intersections I
One, two, or zero solutions—quadratic systems have a variety of solution possibilities. Using the parent function and the standard form of the function, learners describe the values of a, b, and c that produce each solution type. They...
US Department of Commerce
Changes in My State
So much can change in seven years. Young statisticians choose three types of businesses, such as toy stores and amusement parks, and use census data to determine how the number of those businesses in their state changed between 2010 to...
NOAA
A Matter of Density
Larvae transportation on the New England seamounts is based on the density of the water. Scholars calculate density and graph salinity versus temperature to better understand the distribution of organisms in a water column....
US Department of Commerce
My Dream Home
Dream big or go home. After analyzing a bar graph on the number of bedrooms in US homes derived from census data, scholars design their own dream homes. They cut out two-dimensional shapes from construction paper to create models of...
NASA
The Big Climate Change Experiment Lesson 3: Climate Change Lines of Evidence
Consider the preponderance of evidence when making a verdict. The third of five lessons in Unit 1: The Big Climate Change Experiment focuses on the evidence for climate change. Learners study graphs, diagrams, and pictures regarding...
Other popular searches
- Charts and Graphs Math
- Hidden Picture Math Graphs
- Misleading Graphs Math
- Powerpoint Math Graphs
- 1st Grade Math Graphs
- Math Graphs 4th Grade
- Math Reading Graphs
- Animals Math Graphs
- Math Graphs Grade 1
- Creating Math Graphs
- Math Graphs Using M&ms
- Math Interpreting Graphs


