Curated OER
Unit 6b -Year 5
If you have some 9-10 year olds who are ready for some 5th year math, then check out this UK math unit. There are 172 slides that cover all of the basic multiplication tables, relate those to division, fractions, sequencing, and an...
Curated OER
Read a Picture Graph
It's the Bears vs. the Seals! Who is the season winner? Read this data and have your math class answer the six questions that follow. Consider graphing the chart as a class, or encouraging individuals to graph it before answering the...
Curated OER
Graphing Ordered Pairs
Here is graphing worksheet which has pupils graph ordered pairs and label the axis. They graph five ordered pairs and then interpret the data in the graph.
Curated OER
Line Graphs Showing Change Over Time
Students analyze line graphs. In this graphing lesson, students analyze line graphs paying attention to how the data changes over time. This lesson includes two video clips, one demonstrating an increasing line graph and one...
Curated OER
M&M Graphing and Probability
Students sort, classify, and graph M & M's. They create pictographs and bar graphs with the colors and numbers in each bag of M & M's. They calculate the ratio and probability based on class results.
Curated OER
Choose an Appropriate Graph
In this graphs worksheet, learners solve 6 fill in the blank problems where they choose the most appropriate type of graph for each set of data and explain why they chose that type. Students use bar graphs, histograms and circle graphs....
Curated OER
All About Graphs
Students practice organizing data by creating graphs. In this statistics lesson, students survey the class about favorite colors and create a bar graph using the data. Students complete a test based on pet and animal statistics.
Curated OER
Problem Solving Application: Using Circle Graphs
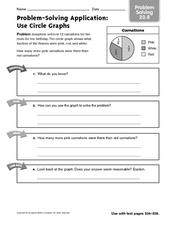
In graphing worksheet, 4th graders use the information from a circle graph about carnation sales to complete the steps of problem solving. They determine what they know, and how they can use the graph. They find how many more pink...
Curated OER
Usage and Interpretation of Graphs
Young scholars explore graphing. In this graphing lesson, students predict how many shoe eyelets are present in the classroom. Young scholars count eyelets and work in groups to organize and chart the data collected. Students put all the...
Curated OER
Graphing Difference
Students use problem solving skills to reason, predict and problem solve through exploration. They recognize a way in which they are different from their peers and create a graph that shows these differences.
Curated OER
Double Bar Graphs (Reteach 15.1)
In this graphs learning exercise, students analyze the data on two double bar graphs. Students answer 4 questions about the information on the graphs.
Curated OER
Tally and Graph
In this survey and graphing activity, students take a survey of 10 friends by asking them to vote for their favorite musical instrument. They fill in a tally chart, track the tally marks, and develop a bar graph with the information.
Curated OER
Graphing
Students collect data to create different types of graphs-line, pie, and bar graphs. They use StarOffice 6.0 to create graphs.
Curated OER
3 Kinds of Graphs
Students construct three different graphs-a line graph, a bar graph, and a circle graph. In this graphing lesson, students use different graphs to display various data that they collect.
Math Moves U
Collecting and Working with Data
Add to your collection of math resources with this extensive series of data analysis worksheets. Whether your teaching how to use frequency tables and tally charts to collect and organize data, or introducing young...
Curated OER
Halloween Point Plot
Practice graphing and plotting points with a festive Halloween flair! Scholars plot 21 points on a grid, connecting them to create a spooky shape!
Math Learning Center
Fourth Grade Assessments and Scoring Checklists, Common Core State Standards
Find out how your class is progressing in math with a set of assessments. Learners finish a baseline assignment to assess where they are beginning the year and then work on tests with increasing difficulty as the year progresses.
Curated OER
Sunshine Math 3
In this word problems worksheet, learners read and problem solve nine mathematical word problems involving grids, measurement, compensation and angles.
Curated OER
Data and Probability: What is the Best Snack?
In this math/nutrition instructional activity, the nutritional value of 3 snack foods is recorded on a data chart and represented on a bar graph. Students analyze and compare information, construct data charts and related bar graphs, and...
Curated OER
Monster Data
An inventive instructional activity shows learners how to collect, organize, and present mathematical data. They access websites which lead them through a variety of ways to engage in data collection. They get to design and create...
Curated OER
Likely Outcomes
A coin toss is a simple and fun way to help youngsters discovery probability. Preferably in partners, they first predict what would happen if they tossed two coins 48 times. How often would two heads show up? Two tails? How about one of...
National Security Agency
Are You Ready to Call the Guinness Book of Records?
Learners design questions that can be answered by collecting data. In this line-plot activity, pupils collect data and graph on a line plot on world records. An abundant supply of teacher support is provided in this resource.
Curated OER
Big Foot Bar Graph
Students explore all the different sizes of feet within their age range while exercising their graphing skills. They work in teams to survey children in their grade to gather data about the different range of shoe sizes. Each group then...
Curated OER
Problem Solving: Use a Graph: Problem Solving
In this bar graph activity, students read the word problem and use the bar graph to complete the problem solving questions for understand, plan, solve, and look back.
Other popular searches
- Charts and Graphs Math
- Hidden Picture Math Graphs
- Misleading Graphs Math
- Powerpoint Math Graphs
- 1st Grade Math Graphs
- Math Graphs 4th Grade
- Math Reading Graphs
- Animals Math Graphs
- Math Graphs Grade 1
- Creating Math Graphs
- Math Graphs Using M&ms
- Math Interpreting Graphs


