Curated OER
Creating Circles
Students make a circle graph. In this graphing lesson, the teacher conducts a class survey, then demonstrates how to make a pie graph. When students are comfortable with the material, they use a worksheet to create their own graph.
Curated OER
Take Another Look
Seventh graders analyze different types of graphs and answer questions related to each. In this math lesson, 7th graders organize a given diagram to make it easier to interpret. They discuss why they made such changes.
Curated OER
Leonardo da Vinci
Students select appropriate tools and technology to perform tests, collect data, and display data. They construct appropriate graphs from data and develop qualitative statements about the relationships between variables.
Curated OER
Computation: How can we use rice to solve problem questions?
Fourth graders graph metric tons of rice produced by various countries. In this graphing instructional activity, 4th graders follow problem solving steps to answer questions about rice nutrition and then graph the amount of rice...
Curated OER
Linear Equations
Seventh graders explore battle plans using grids. In this linear equation instructional activity, 7th graders see how math is used in battle. Students create a grid on the floor using tape and plastic army men to serve as the...
Curated OER
Hollywood's Top Ten
Students gather data on top 10 highest grossing movies, and make a bar graph and a pictogram.
Curated OER
When is Your Birthday?
Students use data about their birthdays to create graphs. In this collecting and communicating information instructional activity, students make a class list of their birthdays. Students use the information to make a bar graph showing...
Curated OER
It's My Time!
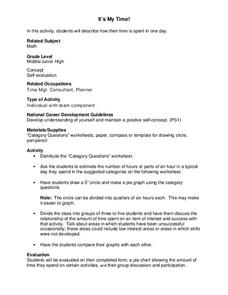
Students create a pie chart. In this time lesson, students determine the amount of time they spend on given activities. They create a pie chart diagraming the data. Students share their graphs with the class.
Curated OER
Jelly Bean Math
Young scholars estimate, measure, compute, and create patterns using jelly beans. In small groups, they solve various calculations, place jelly beans into groups, invent a new flavor, create a pattern, and complete a worksheet.
Curated OER
Let's Keep Track of Grades
Students participate in a technology project. This lesson is a hands-on spreadsheet project where students are responsible for keeping track of their grades for class. The students learn to enter data into a spreadsheet, create...
Curated OER
Probability Using M&M's
Students estimate and then count the number of each color of M&M's in their bag. In this mathematics lesson, students find the experimental probability of selecting each color from the bag. Students create pictographs and bar graphs...
Curated OER
Mathematics Lesson Plan
Second graders study subtraction facts. In this mathematics lesson plan, 2nd graders discuss how to solve two digit subtraction problems. Students recognize that there are many different methods or strategies one can use such as using...
Curated OER
Rooster's Off To See the World Number-Sense
Students recognize how numbers are used in number stories. In this Rooster's Off To See the World lesson, students participate in the story. Students complete a number activity and work on the computer to illustrate a number...
Curated OER
M&M Graphing and Probability
Students create a variety of graphs. They count, sort, and classify M&M's by color and record data on a chart. They use data from the chart to create pictographs, bar graphs and circle graphs. They analyze data and determine...
Curated OER
Graphing with the Five Senses
Students collect data and record it on a bar graph. In this data graphing lesson, each small group of students is assigned to collect data on one of the five senses. They then practice a song that helps them remember the purpose of each...
Curated OER
Graphing Data
Second graders examine how to make and read bar graphs. In this bar graph instructional activity, 2nd graders compare bar graphs to pictographs by looking at hair color survey data. They practice making a bar graph and finding the range...
Curated OER
Speed + Graphing = Winners!
Fifth graders take addition timed tests every day for a two week period. Using the data from the timed tests, they create a bar graph using Microsoft Excel computer software, a personal bar graph using graph paper and colored pencils,...
Noyce Foundation
Ducklings
The class gets their mean and median all in a row with an assessment task that uses a population of ducklings to work with data displays and measures of central tendency. Pupils create a frequency chart and calculate the mean and median....
Kenan Fellows
Dinner Party: Using Pattern Trains to Demonstrate Linear Functions
Nothing fancy here ... just your run-of-the-mill Algebra party! Learners explore the patterns of linear functions while designing seating arrangements for a dinner party. Comparing the number of tables to the perimeter of the combined...
PBS
Working with Coordinate Planes: Assessments
It's time for scholars to show what they know about coordinate planes with a collection of three assessments. The exams' objectives include plotting points on a single grid, measuring using the distance formula, and identifying...
Inside Mathematics
Hexagons
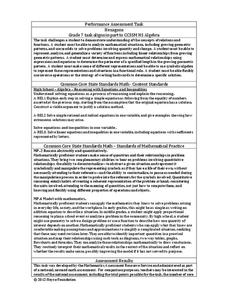
Scholars find a pattern from a geometric sequence and write the formula for extending it. The worksheet includes a table to complete plus four analysis questions. It concludes with instructional implications for the teacher.
EngageNY
Drawing the Coordinate Plane and Points on the Plane
To plot a point in the coordinate plane, you first need a coordinate plane. Pupils learn to draw an appropriate set of axes with labels on a coordinate plane. They must also determine a reasonable scale to plot given coordinate pairs on...
Inside Mathematics
Number Towers
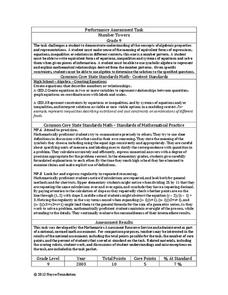
Number towers use addition or multiplication to ensure each level is equal. While this is common in factoring, it is often not used with algebraic equations. Solving these six questions relies on problem solving skills and being able to...
EngageNY
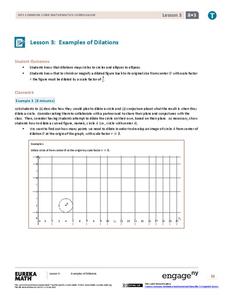
Examples of Dilations
Does it matter how many points to dilate? The resource presents problems of dilating curved figures. Class members find out that not only do they need to dilate several points but the points need to be distributed about the entire curve...


