Curated OER
TIMS, The Bouncing Ball: Math, Science, Measurement, Graphs, Variables
Learners determine the exact relationship between the height from which a ball is dropped and the distance that it rebounds.
Curated OER
Pie Graph
Fifth graders examine fractional parts of pie graphs. Given a bag of M&Ms, 5th graders interpret the data. They use a paper plate and colors to create a graph of the types of M&Ms represented.
Curated OER
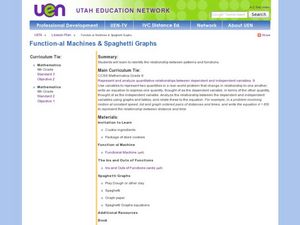
Function-al Machines and Spaghetti Graphs
Sixth graders identify the relationship between patterns and functions. In this algebra instructional activity, 6th graders use a "Functional Machine" to identify the rule. Students use a function table to plot the points using play...
Curated OER
Fast Food Survey Using Bar Graphs
Second graders conduct survey and sort data according to categories, construct bar graph with intervals of 1, and write a few sentences about their graphs.
Curated OER
Food Ways - Graphing
Sixth graders choose the appropriate graph to display collected data. They interview each other on what foods they eat. They also interview elders and find out what types of food they grew up eating. They create graphs to display the...
Curated OER
Introduction to Bar Graphs Lesson Plan
Students organize and interpret data using bar graphs.
Curated OER
Using Averages to Create Graphs Through Excel
Sixth graders create and use a spreadsheet to make graphs which will be used to analyze Progress Report and Final Report Card grades. They practice finding the mean, median, mode, and range of a data set. Students also incorporate column...
Curated OER
Usage and Interpretation of Graphs
Students review graphing and use processing skills to solve problems.
Curated OER
Graphs
Students listen to the book, TOPS AND BOTTOMS looking at different vegetables from the story that they have tried in class that week.
They then focus their attention on a graph called, "What is Your Favorite Vegetable?". They place a...
Curated OER
Bar Graphs Using M & Ms
Fifth graders observe an overhead of a graph on which M & Ms have been poured out. A volunteer comes up and separates the colors writing on the overhead how many there were of each color and another person labels the graph's title....
Curated OER
Graphs
Students create "snowballs" from crumbled pieces of white paper. They then glue their snowball to the appropriate side of the graph to indicate who has and who has not thrown a snowball. The teacher and the calss then will count how many...
Curated OER
Bar Graphs
Third graders examine the main parts of a bar graph and how to round up to the nearest tenth. They make an example of a bar graph and answer questions based on the graph using a list of state capitals and their average temperatures....
Curated OER
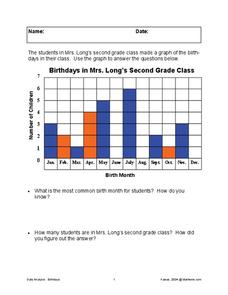
Birthday Graph
In this graphing worksheet, students interpret a graph of "birthdays in Mrs. Long's second grade class" to answer 2 related questions.
Curated OER
Creating Bar Graphs
Fifth graders design and label a bar graph using data taken from a class survey. They observe a teacher-led lecture, write and conduct their survey, and create a bar graph that includes identification of the minimum, maximum, mode,...
Curated OER
Graphs
Students identify the difference between two objects: a glove and a mitten. Those who like gloves raise their hands and receive a glove outline to color and cut out. Then those who prefer mittens will raise their hands and receive a...
Curated OER
Balloon Graphing
Fourth graders explore data, charts and graphs. They create graphs using titles, labels, axes, intervals, and scale correctly. Students enter their data into Excel and create a graph.
Curated OER
Environmental Graphing
Pupils experiment with graphing. In this graphing introduction lesson, students complete four activities: 1) a bar graph based on class birthdays 2) an estimation graph of the raisins in raisin bread 3) another estimation example with...
Curated OER
Name Count and Graph
Students find the frequency of a name in selected states by using the Internet. They input data into a spread sheet. They create a graph that illustrates the gathered information.
Curated OER
Pictograph to Bar Graph
Second graders explore organizing data to make it useful for interpreting picture graphs and bar graphs. They use Graphers software to create a pictograph and a bar graph.
Curated OER
Reading a Graph: Azimuth Range vs. Day in Barrow Alaska
Learners practice reading a graph while doing story problems. They determine the x and y intercepts and calculate the slope. They also practice writing linear equations.
Curated OER
Mine Shaft Grade 8 Slope
Eighth graders investigate slopes using real life scenario. In this algebra lesson, 8th graders model and interpret real life data. They plot their data in a coordinate plane and discuss the results with the class.
Curated OER
Graphing Linear Equations
Ninth graders develop an understanding of and the applications for linear equations and their graphical displays. They participate in a cooperative learning activity of matching a graphic display with an equation.
Curated OER
Paul Bunyan - A Folktale Full of Math
Sixth graders solve math problems from a folktale story. In this solving math problems from a folktale story lesson, 6th graders read the Paul Bunyan folktale. Students determine today's cost of the meals that Paul Bunyan...
Curated OER
Lessons for Atlatl Users with Some Experience-Grade 5
Fifth graders throw darts, collecting data for distance traveled. For this data analysis lesson, 5th graders throw a dart using an atlatl. They calculate the speed for each throw and determine the best dart length for distance throws.


