Curated OER
Geometric Figures and Applications
High schoolers study geometric figures. They use graph paper or Geometer's Sketchpad to construct and decorate geometric shapes, and also create a 3-D polygon using construction paper and a given template.
Curated OER
Graphing Galore!
Students practice sorting and counting different objects. Using this information, they create graphs on a worksheet given to them. They describe and analyze the results and discuss them as a class to end the instructional activity. ...
Curated OER
Using My Nasa Data To Determine Volcanic Activity
Students use NASA satellite data of optical depth as a tool to determine volcanic activity on Reunion Island during 2000-2001. They access the data and utilize Excel to create a graph that has optical depth as a function of time for the...
Curated OER
Mmm, Mmm, M&M's
Here is another version of the classic M&M math lesson. In this one, upper graders utilize the ClarisWorks Spreadsheet program in order to document the data they come up with from their bags of M&M's. After making their initial...
Curated OER
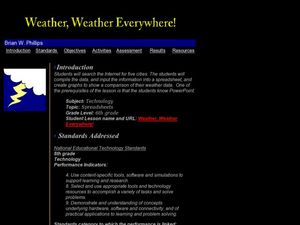
Weather, Weather, Everywhere!
Sixth graders collect weather data to compare temperatures around the world. Using the Internet, learners collect data, put it into spreadsheets, and analyze and graph the results. An interesting way to cover the topic of weather.
Curated OER
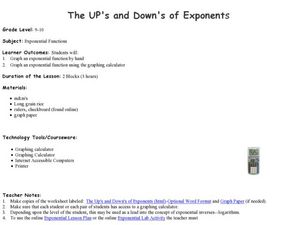
The UP's and Down's of Exponents
Students explore the concept of exponents. In this exponential functions worksheet, students complete provided worksheets that require them to graph exponential functions by hand as well using graphing calculators.
Curated OER
A Christmas Project
Seventh graders publish a letter and spreadsheet using the computer. They build a three-dimesnsional object with construction paper and develop a Christmas object using coordinates on a graph. Students compose a response in their journals.
Curated OER
The Number Line
Eighth graders investigate the order of numbers and how they are located on the number line. They also review the symbols used to compare quantities in order to decipher simple expressions and graph them on the numberline.
Curated OER
Our Favorite Season Lesson Plan
Fifth graders complete a survey about their favorite season of the year. Using Excel, they create a graph using the chart wizard and copy it into Microsoft Word. They explore the relationship between the survey and the bar graph.
Curated OER
Introduction to Scatter Plots and Correlation
Learners examine the concept of scatter plots. They compare baseball statistics to locate the ones that correlate with winning, and identify the positive, negative, and no correlation in sets of data using MS Excel.
Curated OER
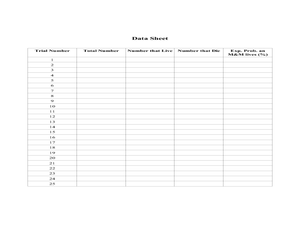
Get a Half-Life!: Student Worksheet
In this math/science worksheet, students will work in pairs to conduct an experiment based on a decay function which is often used to model radioactive decay. Students will shake M & M's in a cup to rub off the M and then record...
Curated OER
RIP M&M's
Students solve theoretical probability problems. In this algebra instructional activity, students apply the concept of probabilities to solving real life scenarios. They collect data and graph it using experimental probability.
Curated OER
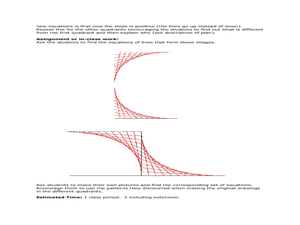
Mathematics of Doodles
Students use the slope and y-intercept to graph lines. For this algebra lesson, students graph linear equations and apply it to solving real life problems.
Curated OER
Quadratic Equations and Parabolas
Students graph and solve quadratic equations. In this functions lesson, students analyze a quadratic equation using three points on a curve to define the graph of a quadratic function. They find the vertex and intercepts of the graph.
Curated OER
The Window Problem
Students identify patterns and compute formulas to solve the problems. In this algebra instructional activity, students come up with a rule given a pattern, and analyze the relationship between data and graphs.
Curated OER
Three In a Row
Sixth graders examine how to locate coordinate points. In this coordinate graphing lesson, 6th graders locate the x and y axis. Students use their arms to show horizontal and vertical lines, participate in group and...
Curated OER
Statistics with State Names
Students analyze the number of times each letter in the alphabet is used in the names of the states. For this statistics lesson, students create a stem and leaf plot, box and whisker plot and a histogram to analyze their data.
Curated OER
Scale Drawing
Learners use ratio and proportions to solve problems. In this geometry lesson, students apply ratio and proportions to real life scenarios.
Curated OER
Slope and Topographic Maps
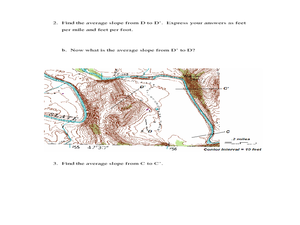
Learners investigate slopes as they study topographic maps. In this algebra lesson, students discuss and apply the concept of slopes to graphing and analyzing data.
Curated OER
Polly and the Shapeshifter
Students analyze the patterns in polygons and relate it to the rate of change. In this algebra lesson, students discuss the relationship between the data and the graph of the data.
Curated OER
Comparing Area and Perimeter
Students solve problems by finding the perimeter and area of an enclosed area. In this geometry lesson, students differentiate between the area and the perimeter. They see how they relate and how to use it to maximize an enclosed area.
Curated OER
Celsius to Fahrenheit
Students convert degrees between two different units. In this algebra lesson, students graph linear equations and identify the line of best fit. They use their line of best fit to make predictions given a set of data.
Curated OER
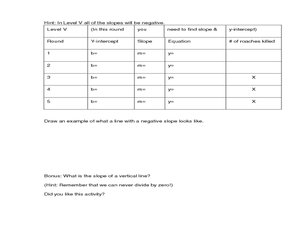
Cockroach Slope
Students identify the slope of linear functions. In this slope lesson, students collect data and graph it. They write equations with no more than two variables and use technology to explain their data.


