Curated OER
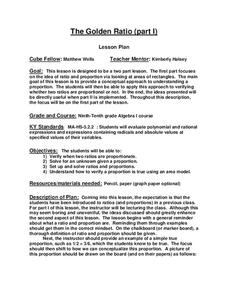
The Golden Ratio
Students solve problems using ratios and proportions. For this algebra lesson, students verify proportions, solve for the unknown and use real life scenario to model proportion.
Curated OER
Pick's Theorem
Students investigate polygons and their lattice. In this calculus instructional activity, students record data using different methods. They analyze their data and draw conclusions based on the relationship between the area and the...
Curated OER
Collecting Data and Graphing
Eighth graders, in groups, count the different colors of M&M's in each kind of package and then draw a pictograph to show the results. Each group writes a program to show their results and then compare the manually-drawn and computer...
Curated OER
Integrated Algebra Practice: Box and Whisker Plots
In this box and whisker plot worksheet, students solve 5 short answer problems. Students use box and whisker plots to describe data and determine what percentile a piece of data belongs.
Curated OER
Fourth Grade Mathematics Quiz
For this math worksheet, 4th graders complete multiple choice questions about multiplication, bar graphs, rounding, and more. Students complete 15 questions.
Curated OER
Graphing With Second Graders
Second graders sort M & M's and then enter the data into a spreadsheet in order to create a simple graph. After printing the spreadsheet generated graph, have students compare the printed graph with their paper graph.
Curated OER
Candy Land Math
Students order numbers and sets of objects from 0 through 10 and organize and interpret information collected from the immediate environment. They read and interpret graphs usin real objects and the computer. Finally, students sort a...
Curated OER
Probability Using M & M's
Students develop an understanding of probability by sorting bags of M & M's by color and recording the results in percents. The data is entered onto a spreasdsheet and graphed.
Curated OER
Delicious Graphing
Fourth graders sort trail mix by type and use that information to create different types of graphs for comparing.
Curated OER
Organizing Data
In this statistics worksheet, 11th graders collect data and organize it using a frequency table. They plot their data and analyze it using stem and leaf plots. There are 3 questions with an answer key.
Curated OER
Migration of the Neo-Tropical Songbirds
Fifth graders plot the migration of birds using Google Earth. In this lesson on bird migration, 5th graders work in groups to plot the migration of a group of birds using Google Earth. Students present and discuss their findings and look...
Curated OER
New York State Testing Program: Mathematics Test Book 2
In this mathematics test book, students answer problems dealing with topics covered during the year. They solve problems dealing with percent, probability, properties, and interpreting graphs. This sixteen page worksheet contains...
Curated OER
Excel for Beginners
In this Excel lesson, students set a formula to check their homework. Students also use clipart, work in groups, and learn to use the tools in the drop-down list.
Curated OER
Linear Equations
In this algebra worksheet, 11th graders solve linear equations and rewrite them in the form y=mx + b. They graph the equations using the slope and y-intercept. There are 22 questions with an answer key.
Curated OER
Get a Half-life!
Pupils explore decay functions and the half-life of a substance. Through an M&M activity with calculators, students collect and graph data. They determine the linear, quadratic and exponential functions of the graph. Pupils...
Curated OER
Get a Half-life!
Students use m&m candies as their sample set. They begin by counting the total number of candies to determine their sample size. Students put the candies into a cup and shake them gently before pouring them onto a paper plate. Count...
Curated OER
Polynomial Functions
Students explore polynomial functions. In this Algebra II lesson, students explore graphs of polynomial functions as classify the functions as linear, quadratic, cubic, or quartic. Students determine the regression equation...
Curated OER
Family Vacation
Students use math to plan a trip by houseboat down the Mississippi River. They research and obtain information on the Mississippi River and its surroundings and use multiple graphs to represent their data.
Curated OER
Summer 1999, MA 123: Cumulative Review
In this math learning exercise, students work to complete the review for a final part of an Algebra II class. The sheet has review problems.
Curated OER
Prime and Composite Numbers, Prime Factorization
Middle schoolers research prime and composite numbers. With a partner, students use graph paper to draw rectangles of various sizes. They list the dimensions of rectangles and discuss how the dimensions relate to the factors of each...
Curated OER
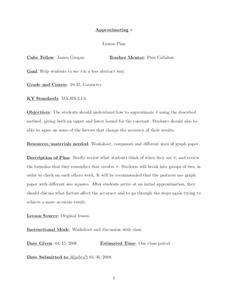
Approximating Pi
Students approximate Pi using the lower and upper bound for the constant. In this algebra lesson, students work in groups of two to graph a circle and approximate Pi using the circumference. They repeat their estimation until they come...
Curated OER
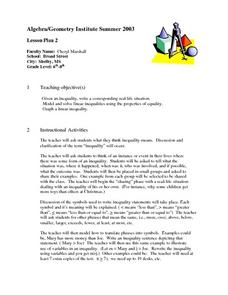
Lesson Plan 2: Linear Inequalities
Students investigate linear inequalities and the associated symbols. After a teacher demonstration, they translate given phrases into symbols. Students solve and graph solutions to linear inequalities. Using newspapers, they locate...
Curated OER
Lesson Plan 3: Inequalities
Ninth graders study inequalities. After a teacher demonstration, classmates solve and graph inequality problems. In groups, they are assigned specific tasks that lead to the solving of inequality word problems.
Curated OER
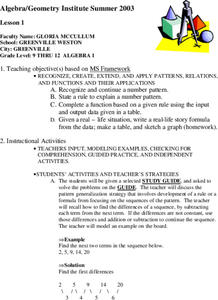
Patterns, Relations, and Functions
Learners investigate the patterns of different data sets of numbers. They use critical thinking skills in order to find the missing numbers in any given set. This instructional activity helps to develop the skill of number sense.
