Curated OER
Secant and Tangent Lines
Twelfth graders recognize the use of the slope of the secant line and connect it with the graph of the secant line, as the secant line approaches the tangent line. They also recognize the two forms of the slope formula used and practice...
Curated OER
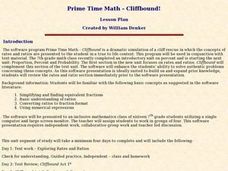
Prime Time Math
Seventh graders use educational software in order to practice lesson plan objectives. They define rate and ratio. Students solve distance problems given two variables. They also use a problem solving strategy that can be defended in its...
Curated OER
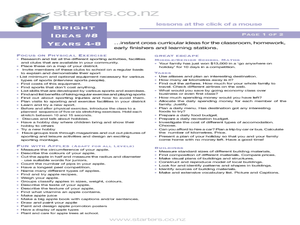
Bright Ideas #8
Students complete the cross curricular activities as part of extra time assignments, homework activities, or learning station activities. In this extra time lesson, students complete activities as learning stations or homework. Students...
Curated OER
#3 Differential Calculus
Students create models of the Mean Value Theorem. In this Mean Value lesson, students use their knowledge of derivatives and exponential functions to explore the Mean Value Theorem. They illustrate the meaning of the throrem,...
Curated OER
Exploring Transformations
Students explore what happens when geometric figures are transformed on the coordinate plane. They work in pairs, moving geometric shapes in the plane, and formalize their rules as functions.
Curated OER
Y-Intercept and Slope Intercept Form
Alegebra amateurs identify the slope and the y-intercept given a linear equation in slope-intercept form by correctly completing some in class problems. They write the linear equation in slope-intercept form that corresponds to the given...
Ohio Department of Education
The Solution is Complex
Consider complex numbers, roots, and quadratic equations. Use the discriminate as a way to determine the nature of a quadratic's roots. Then discuss the similarities and differences between quadratics with two, one, or no real roots....
Illustrative Mathematics
Eight Circles
We are used to finding the area of a circle by plugging the radius into an equation. Here, learners are required to go further to find multiple areas and calculate the difference. They must detect a pattern in order to figure out the...
Alabama Learning Exchange
Binomial Expansion—Shortcut Please
There has got to be a better way; you just have to find it! Given a general binomial to expand with increasing powers, pupils realize that there must be a better way than multiple multiplications. Classmates look for patterns and use...
Curated OER
Similar Triangles
Tenth graders practice solving proportions from similar triangles. They watch a PowerPoint presentation and complete a worksheet each of two days of this lesson. Links for worksheets and PowerPoint presentations are included with this...
Curated OER
Multiplying Polynomials
Help learners study polynomials. They will review how to multiply polynomials either by using the FOIL method if they are multiplying a binomial by another binomial, or by using the distributive property.
Manchester University
Lesson 51: Scientific Notation
Discuss scientific notation with this mathematics lesson. Middle schoolers predict which problem is bigger of two numbers. They analyze the problems by observing the powers of 10 in order to decide which is bigger. This appears to be an...
Curated OER
The Pythagorean Theorem
Young scholars research Pythagoras and learn how to apply his theorem. They solve real life problems using the theorem and demonstrate knowledge of exponents, equations, and radicals. Students include diagrams in their research papers.
Curated OER
Graphing Memories
Mem Fox’s Wilfrid Gordon McDonald Partridge provides the labels for a graphing activity. Class members create an illustration of a memory item brought from home, and place their illustration in the proper column of a graph. When the...
Curated OER
Probability Experiment Simulation: Design and Data Analysis Using a Graphing Calculator
Seventh graders simulate probability experiments. Using a graphing calculator, 7th graders design, conduct, and draw conclusions from simulations or probability experiments. Students construct frequency tables and compare the...
Curated OER
Graph Frenzy!!
Students brainstorm for a survey question to ask classmates. They survey their classmates. They enter the results into a spreadsheet and create the best graph for the information. They share their graphs with the class.
Curated OER
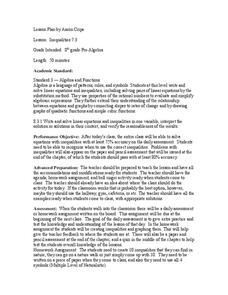
Inequalities 7.3
Graph inequalities and discuss the difference in their slopes. Learners observe rate of change as they compare linear, quadratic, and cubic functions.
Curated OER
Fractions Continued
Students investigate the concept of using fractions to solve problems involving rational numbers. They order real numbers on the number line with the classification of fractions. Also students solve problems using the four operations...
Curated OER
Definition Of The Derivative
Students engage in a lesson that is concerned with the concept of a derivative. They define the concept of a derivative and then complete an assignment that is included in the lesson. Students then graph the derivative and draw its...
Curated OER
Measurement: Perimeter and Area
In this perimeter and area lesson, young scholars learn the formulas for perimeter and area and view model problems using tiles. Students work in groups to solve practice problems. Young scholars define perimeter and area and...
Curated OER
Exploring Linear Equations And Scatter Plots - Chapter 5 Review
Students complete rolling stocks experiment, and collect and enter data on the computer. They enter data on graphing calculators, complete scatter plot by hand with line of best fit, and discuss different graphing methods.
Curated OER
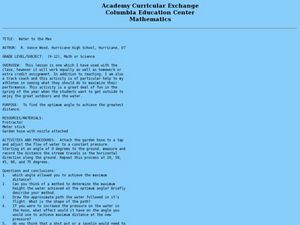
Water to the Max
Students experiment with the angle that yields the greatest distance of water at constant pressure. In this experiment with the angle that yields the greatest distance of water at constant pressure instructional activity, students...
Curated OER
Pattern Block Activities
Students practice various math skills by using manipulative activities. In this math manipulative lesson, students sort shapes, build hexagons, and build shapes using manipulatives. These activities would be great for parent ed or...
Curated OER
The Baby Boom -- How Do We Know it is a Boom?
Young scholars examine graphs of three statistics and use basic math to compute their own. They evaluate the implications of manipulating data and whether statistics are appropriate for creating policy.

