Curated OER
Comparing Exponentials
Growing money exponentially is the context of this scenario that asks learners to compare investments in two certificate of deposit accounts. Your young investment analysts will learn about the exponential characteristics of money...
Statistics Education Web
The United States of Obesity
Mississippi has both the highest obesity and poverty rate in the US. Does the rest of the data show a correlation between the poverty and obesity rate in a state? Learners tackle this question as they practice their skills of regression....
Statistics Education Web
The Case of the Careless Zookeeper
Herbivores and carnivores just don't get along. Using a box of animal crackers, classes collect data about the injury status of herbivores and carnivores in the box. They complete the process of chi-square testing on the data from...
University of Utah
Explore Proportional and Linear Relationships
Progress from proportional relationships to linear functions. Pupils first review concepts of proportionality covered in earlier grades. They then extend these concepts to linear functions, such as determining the slope of a...
Curated OER
Measures of Central Tendency Using Scientific Calculators
Learners explore mean, median, and mode as they model mathematics in real-world problem situations. The lesson requires the use of the TI 30X IIS.
Curated OER
Stock Swaps, Variation 3
More on the fictitious takeover of the Apple Corporation by Microsoft. In this scenario, Microsoft has $28.00 per share to spare, so how many do they need to offer to make an even trade? This is an engaging problem to solve when...
Illustrative Mathematics
Invertible or Not?
Two for one—create an invertible and non-invertible function from the same data. The task presents a function table with missing outputs for the class to use to create two functions. One of the functions should have an inverse while the...
Mathematics Vision Project
Module 9: Modeling Data
How many different ways can you model data? Scholars learn several in the final module in a series of nine. Learners model data with dot plots, box plots, histograms, and scatter plots. They also analyze the data based on the data...
Shodor Education Foundation
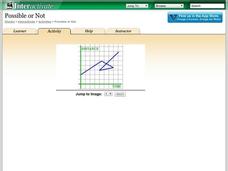
Possible or Not?
What does the graph mean? Pupils view 10 graphs and determine whether they are possible based on their contexts. The contexts are distance versus time and profit versus time.
Mascil Project
Amberhavn: New Bus Network
Public transportation is an important aspect of any growing city. Collaborative groups work to redesign a system for a city in need of restructuring. Young scholars design a route, create a timetable, and incorporate a quality control...
Mathematics Vision Project
Module 3: Features of Functions
Learn how to represent functions in multiple ways. Learners analyze functions as equations, graphs, and verbal descriptions. The analysis includes intercepts, behavior, domain, and range. The module of seven lessons makes up the third...
Mathematics Vision Project
Module 1: Sequences
Sequences are all about recognizing patterns. A module of 11 lessons builds pupils' understanding of sequences through pattern analysis. The practice connects the analysis to linear and exponential equations. This is the first module in...
Curated OER
Exploring Number Systems
Students work in a group to prepare a poster about a new number system. They research a variety of number systems, create new symbols for their original number system and develop a tutorial for the class.
Curated OER
Exploring Transformations
Students explore what happens when geometric figures are transformed on the coordinate plane. They work in pairs, moving geometric shapes in the plane, and formalize their rules as functions.
Curated OER
School Activities
First graders place some specific types of objects (e.g., shoes, favorite food) on concrete graphs and pictographs. They listen and respond to others in a variety of contexts (e.g., pay attention to the speaker; take turns speaking in a...
Curated OER
Halloween Counting Book
First graders recognize and write numerals from 1 to 10. They estimate and count to identify sets with more, fewer, or the same number of objects, listen and respond to others in a variety of contexts, and take turns speaking in a...
Curated OER
Breakfast Before School
Are the events "I eat breakfast" and "I am late for school" independent events? Assess learners' understanding of independence in a simple context with this short worksheet. Use as an opener, as part of an assignment, or discuss together...
Illustrative Mathematics
The High School Gym
Learners apply critical thinking skills as they analyze data about the temperature inside a gymnasium during a school assembly. The focus is on representing temperature as a function of time and interpreting input and output values...
Illustrative Mathematics
Making Hot Cocoa, Variation 1
Dividing with fractions can be a confusing task to some, but the activity illustrates how to make groups out of the problem and look at it visually. Use this problem with the instructional activity in the Additional Materials section to...
Curated OER
Basketball Bounces, Assessment Variation 2
This un-scaffold summative assessment tasks learners to use the height of a bouncing basketball, given the data in graph and table form, to choose the model that is represented. Learners then use the model to answer questions about...
Curated OER
A Valuable Quarter
Your young bankers model an account balance with an exponential function and solve the equation by extracting a root or taking a logarithm. The task involves the context of annual and compounding interest as well as some interesting...
Curated OER
The Customers
Exploring functions not represented by an expression is this task's secret. As your learners organize business customers in a database, they explore the definition of what it is to be a function.
Curated OER
Pythagoras' Theorem
Students are introduced to the Pythagoras' Theorem and its history, proofs and practice in application. Students find perimeters, areas and volume of everyday objects. Students state and explain the theory.
Curated OER
Problem Solving Model
Use a vocabulary chart to introduce math functions. The class defines a list of mathematical vocabulary terms on a worksheet, as well as completes equations and expressions. They examine word problems and practice transcribing them into...


