Curated OER
Reading Charts
How well can your third graders interpret data from a chart? Use this straightforward worksheet to reinforce problem-solving skills. After reading a school schedule, pupils answer ten questions about the information in the chart. A great...
Federal Reserve Bank
Financial Fables: Shopping Wisely with Olivia Owl
Cover two subjects with one instructional activity! First, dive into English language arts; read an eBook, answer comprehension questions, and complete a cause and effect chart about the financial fable, Shopping Wisely with Olivia...
Math Drills
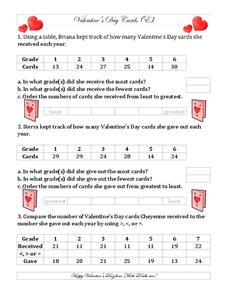
Valentine's Day Ordering and Comparing (E)
Love is in the air, and in a math table! Young learners chart the number of cards from each grade from least to greatest in three Valentine's Day word problems.
K12 Reader
Eratosthenes: Geographer and Mathematician
Mathematicians can be famous, too! Introduce your class to Eratosthenes with a reading passage. After they complete the passage, learners respond to five questions, some of which require opinions and others reading comprehension skills.
Curated OER
Read a Picture Graph
It's the Bears vs. the Seals! Who is the season winner? Read this data and have your math class answer the six questions that follow. Consider graphing the chart as a class, or encouraging individuals to graph it before answering the...
National Security Agency
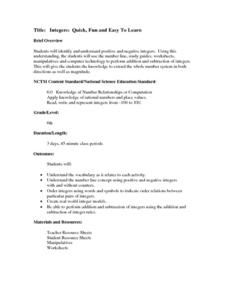
Integers: Quick, Fun and Easy To Learn
A good complement to any integers unit contains a three-day lesson plan about positive and negative integers, adding and subtracting integers, and how to find the additive inverse. Additionally, it provides all necessary...
TESCCC
Place Value to 999,999
Master place value with a series of lessons that use math journals, manipulatives, and place value mats. Kids follow the instructions to represent numbers of all sizes with base ten blocks and recording sheets.
Balanced Assessment
Presidential Popularity
Media often misrepresent data and statistics to their advantage. This lesson asks scholars to analyze an article with misleading statistics. They use margin of error and mean data in their studies. Once they complete their analysis,...
National Math + Science Initative
Introduction to Decimals
Three activities make up an introductory lesson designed to create a strong foundation in comparing fractions to decimals and exploring and building decimal models. Pupils brainstorm and complete a Venn diagram to show how decimals and...
K12 Reader
Geometric Shape Names
Combine math and language arts in the same lesson with a reading passage about number prefixes in geometric shapes. After reading several short paragraphs about the different prefixes used in shape names, kids answer five comprehension...
Curated OER
Subtract Using a Hundred Chart
In this subtraction practice worksheet, students sharpen their problem solving skills as they solve 6 story problems that require them to use a hundred chart to complete.
Curated OER
Alexander, Who Used to be Rich Last Sunday
What a great way to incorporate Judith Viorst's story, Alexander, Who Used to Be Rish Last Sunday, with a math lesson on money. Second graders listen to the story being read while the teacher stops to record each time Alexander spends...
Curated OER
Lesson 6-7: Scatter Plots and Equations of Lines
In this scatter plot worksheet, students examine tables and write a linear equation that matches the table. Students graph linear equations. They read scatter plots, determine the trend line, and write a linear equation to...
Super Teacher Worksheets
Number Patterns
Pattern recognition is an essential step in the development of young mathematicians fluency with the four basic operations. This simple skills practice worksheet asks children identify and complete three different...
Curated OER
Reading a Schedule
In this math problem solving worksheet, students complete 4 questions in which the time on a clock is compared to a daily schedule chart. Students circle the correct activity for each time.
West Contra Costa Unified School District
Decimals and Fractions
Reinforce the concept of fractions and decimals as part of a whole with a lesson plan that begins with a mixed review, then goes into a three problem guided practice, and ends with a collaborative activity. The guided practice and...
Curated OER
The Value of Education
The real value of education is highlighted in more than one way on a worksheet designed to not only add, subtract, multiply, and divide decimals to hundredths, but also to address the correlation between higher pay...
Charleston School District
Graphing Functions
How do letters and numbers create a picture? Scholars learn to create input/output tables to graph functions. They graph both linear and nonlinear functions by creating tables and plotting points.
EngageNY
Solving Problems by Finding Equivalent Ratios II
Changing ratios make for interesting problems. Pupils solve problems that involve ratios between two quantities that change. Groups use tape diagrams to represent and solve classroom exercises and share their solutions.
EngageNY
Ratios II
Pupils continue the study of ratios by creating ratios from a context. The contexts present more than two quantities, and scholars create contexts that match given ratios.
University of California
Seasons Lab Book
Unlock the mystery behind seasonal change with a collection of worksheets and activities. Whether they are drawing pictures of Earth's orbit around the sun or graphing the temperature and daylight hours of different locations...
Curated OER
Problem Solving: Break a Problem into Parts
Learners work with the strategy of breaking a problem into parts in order to solve it. They write an expression with parentheses for each of the first three problems, and solve the problem, and use information from a table to answer the...
Curated OER
Teaching Ideas and Resources
In this teacher website, teachers have access to a variety of tools and resources. Teachers can utilize plans, lessons, and worksheets in all subject areas.
Curated OER
Make a Tally
In this tally chart worksheet, students read the word problems and use the information within the problem to make a tally chart. Students use the tally charts to help them finish and solve the word problem.


