Hi, what do you want to do?
Pennsylvania Department of Education
Alike and Different
Students compare and contrast objects and are introduced to a Venn Diagram. In this alike and different lesson, students make observations regarding properties of objects. Students classify object and build ideas about variables....
Curated OER
Marshmallows
Third graders estimate the volume and mass of one marshmallow using appropriate standard units. They design and carry out an investigation to find the average of volume/mass of one marshmallow.
Curated OER
The Old Chicken Run Problem
Sixth graders apply problem solving strategies to work with a real life situation in which they need to determine the area. They determine the area of chicken runs that are rectangular in shape when give a partial perimeter.
Curated OER
Squirt
Fourth graders using the idea of "how many more squirts" fill a container to develop multiplicative thinking. They also investigate the idea of conservation of volume when working with oddly shaped containers. They attempt to use...
Curated OER
Houses
Third graders use a number of problem solving strategies in this unit of lessons. They determine how to draw and model three-dimensional objects, use co-ordinate systems, determine probability of events, and identify paths of simple...
Curated OER
Surface Area and Volume of a Cube
Students explore finding the surface area and volume of cubes and cylinders. They construct similar three-dimensional figures from a two-dimensional drawing. Students derive the formula for volume and surface area through examination...
Curated OER
Perimeters, Patterns, and Conjectures
Students discover patterns and write conjectures relating to perimeters and polygons. Working in cooperative learning groups, they use manipulatives and graphic organizers to solve problems then answer a series of questions in which they...
Curated OER
Mean, Median, and Mode
Eighth graders practice using the LIST key on graphing calculators using the proper syntax. They work with the functions of mean, median, and mode in a teacher led lesson and then with a partner on a second data set. They follow...
Curated OER
Cartesian Coordinate System
Students research the Cartesian Coordinate System and its many uses in the world of mathematics and algebra.
Curated OER
Introduction to Scatter Plots and Correlation
Pupils examine the concept of scatter plots. They compare baseball statistics to locate the ones that correlate with winning, and identify the positive, negative, and no correlation in sets of data using MS Excel.
Curated OER
A thousand seconds
Students use seconds, minutes, and hours. They then discuss the size of a thousand. After that they read time in digital or analogue form.
Curated OER
Rotations
Young scholars discuss the concepts of reflection, rotation, and translation. For this rotation activity, students investigate rotations through examples on an overhead projector. No additional worksheet or student assignment is included.
Curated OER
Students Analyze Data With Scatter Plots
Scatter plot lessons can help students create different types of graphs by hand or with the aid of technology.
Curated OER
Water Pressure Blaster
Third graders complete an experiment to introduce them to the concept of water pressure. In this water pressure lesson plan, 3rd graders create pressure in a water bottle and observe the force of water that is created.
Curated OER
Hold on Tight!
Learners explore the relationship between plant roots and the soil in which they grow. They examine photos of uprooted trees and desert areas and
conduct experiments designed to highlight this mutual relationship between roots and soil....
Curated OER
Travel Mug Design
Students create and develop a travel mug. They create visuals and a three dimensional infomercial. They apply an engineering design and demonstrate knowledge of thermodynamics involved in heat transfer. They illustrate Newton's Law of...
Curated OER
PLANETS IN PROPORTION
Students discover scales for both the solar bodies' relative sizes and their distances from the sun. They find equatorial circumference and volumes of their solar bodies. Students apply estimation strategies and proportioanl reasoning to...
Scholastic
Scholastic: Max's Math Adventures: Max's Measuring Mania
Read about how Max and Ruthie measured some fun objects in their gym. Use this method to measure things in your classroom. A helpful teacher's guide and extra challenges will make this a fun instructional activity on measuring with...
National Council of Teachers of Mathematics
The Math Forum: Intro to Measurement for Primary Students
This site from the Math Forum is a great introduction to measurement for primary students. Each measurement activity has four components: interactive, manipulative-based project; technology; paper/pencil practice; literature connection.
CK-12 Foundation
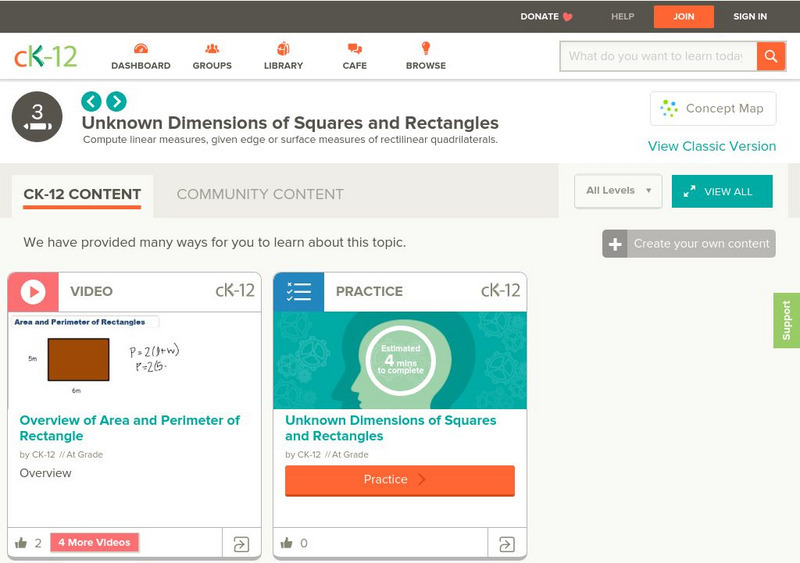
Ck 12: Elem Math: Unknown Dimensions of Squares and Rectangles (Grade 3)
[Free Registration/Login may be required to access all resource tools.] This learning module features five videos and a set of practice questions in which students learn to compute linear measures, given edge or surface measures of...
National Council of Teachers of Mathematics
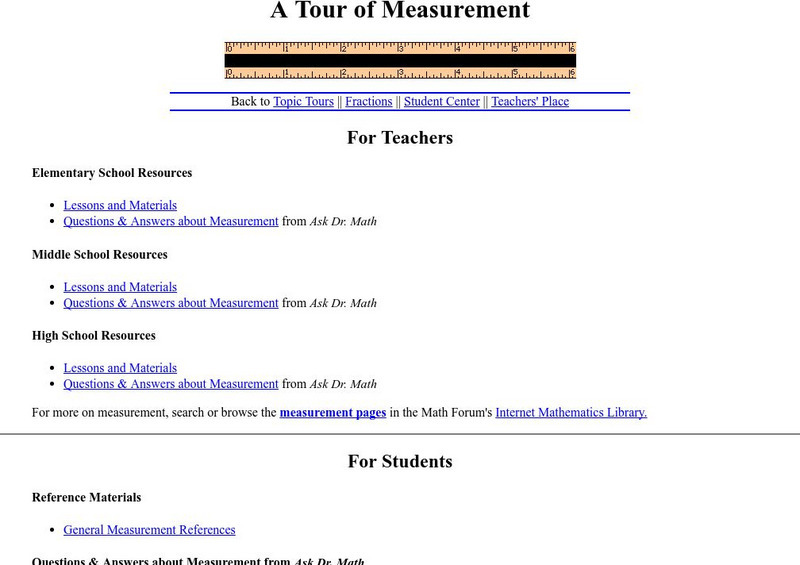
The Math Forum: A Tour of Measurement
Peruse a collection of lesson plans, resources and FAQ's about measurement at every grade level.
University of Regina (Canada)
University of Regina: Math Central: Atlatl Lessons Grades 4 12
What is an atlatl? Learn how this Aztec dart throwing tool can be used to teach students such things as distance, radius, and linear and angular velocity. Curriculum strands are provided for each of the many lesson plans for students...
National Council of Teachers of Mathematics
Nctm: Figure This: Math Challenges for Families
Students, teachers, and parents alike will enjoy this challenging math site. It contains a clever brain teaser section plus creative problems related to algebra, geometry, measurement, numbers, statistics, and probability. A Spanish...
Math Medics
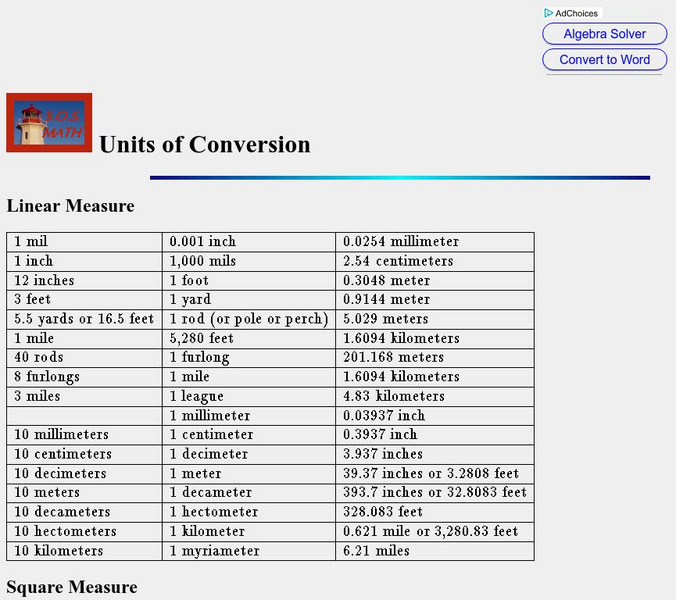
S.o.s. Math: Units of Conversion
Use this chart to easily identify conversions using square measurements, cubic measurements, and linear measurements.


