Curated OER
Make Your Own Shape Puzzles
Students create their own shape puzzles. They practice putting puzzle pieces together so they fit correctly. They classify and sort the different shapes as they finish the puzzle.
Curated OER
Traveling to Japan: Which Way Do We Go?
Fourth graders explore the different types of ways to measure the distance between Florida and Japan.
Curated OER
Four Famous Faces
Each one of our quarters is embellished with a famous face or image representing the state it came from. This lesson uses South Dakota's state quarter to get kids thinking about monetary value, what the president of the United States...
Curated OER
Who Wants to Spend $20,000?
Who wouldn't want $20,000 to spend? But, the question becomes, what do you spend it on? Learners discuss loans, interest, and making adult-like financial decisions. They role-play a scenario that depicts the choices of a girl who took...
Curated OER
Are You Balanced?
Fifth graders discuss what it means to have balance in their lives. Individually, they are given a worksheet in which they list their activities and things they are involved in. To end the lesson, they place weights on each side of a...
Curated OER
Introduction to Magnetism and Electronics
Young scholars are introduced to the concepts of magnetism and electronics. As a class, they walk through the steps of the scientific method and define new vocabulary. In groups, they are given a bag of objects and they are to separate...
Curated OER
Leaping!
Students properly leap and measure their distance. In this leaping lesson, students practice leaping for accuracy and proper form. Students estimate their leaps and measure with rulers. Students determine distance covered by the entire...
Curated OER
Problem Solving Using Coin Identity and Coin Value
Students identify characteristics of a penny, nickel, dime, and quarter, match the value of coins, and practice using money for a purchase.
Curated OER
Zeros and Blackbirds
Fifth graders convert kilometers to miles and calculate the range that historical aircraft can travel. They choose destinations by distance that can be traveled without refueling.
Curated OER
Animal Babies
For this animals worksheet, students play a matching game much like the game memory where they match the animals to their babies. Students match as many cards as they put out.
Curated OER
Here Today-Gone Tomorrow
Students explore changes and how to adapt to them. They discuss the seasons, changes in the weather, and different stages of matter. Students write a poem about change. Additional cross curriculum activities are listed.
Curated OER
Reading Trees: Understanding Dendrochronology
Learners examine tree-ring dating and discuss the lack of water the settlers in Jamestown faced. They create paper tree rings, simulate rain patterns, and describe the history of construction paper tree sequences.
Curated OER
Understanding Distance in Space
Students discover the vocabulary used for distances in space and review measurement units and instruments before creating a scale model of the planets. They determine how to calculate the relative distances between the planets using a...
Curated OER
Geometry House!
Fourth graders use computer drawing tools to create a house of geometric shapes.
University of Regina (Canada)
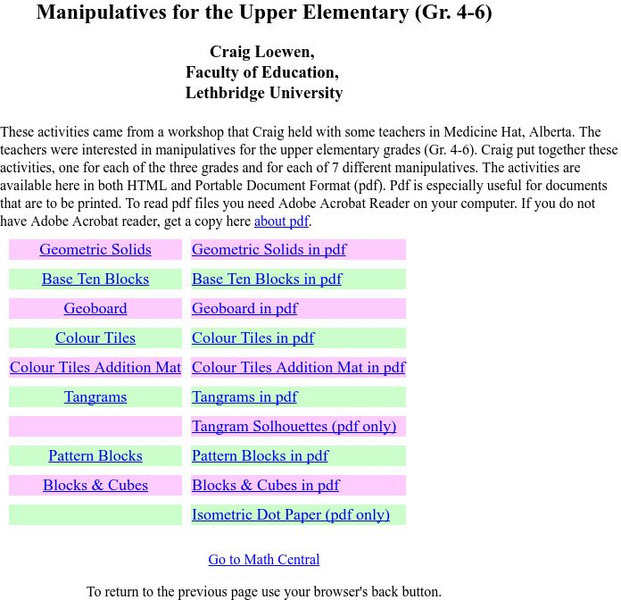
University of Regina: Math Central: Manipulatives for the Upper Elementary (Gr. 4 6)
Many teachers find it more challenging to incorporate the use of manipulatives into their mathematics programs at the upper elementary or middle school grades. Activities using manipulatives are provided for grades four, five, and six...
Science and Mathematics Initiative for Learning Enhancement (SMILE)
Smile: Lesson: An Introduction to Estimation and Measurements
Pancakes anyone? Students explore estimation and measurement by learning how to make pancakes. A hands-on instructional activity designed for students in grades 3-5 where students are engage in hand-on experiences involving measuring...


