Charleston School District
Analyzing Scatter Plots
Scatter plots tell a story about the data — you just need to be able to read it! Building from the previous lesson in the series where learners created scatter plots, they now learn how to find associations in those scatter plots. They...
Curated OER
Graph Picture (Coordinate Pairs)
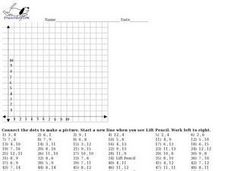
Coordinate graphing on a grid is the focus of this worksheet. Young mathematicians plot 42 coordinate pairs on a graphing grid, then connect the dots to make a picture. A fun way to get your learners involved in graphing!
Curated OER
Graph Picture (Coordinate Pairs) 2
Looking for an engaging way to encourage your class to practice graphing coordinate pairs? This might be the activity you are looking for! For this worksheet, learners create a picture by plotting 54 coordinate pairs on graph and then...
Curated OER
Graph Picture (Coordinate Pairs) 3
Here is a very good coordinate graphing worksheet. Learners practice graphing by plotting 58 coordinate pairs, then connecting the dots to reveal a picture. This resource could be used as an in-class activity or a homework assignment.
Charleston School District
Graphing Functions
How do letters and numbers create a picture? Scholars learn to create input/output tables to graph functions. They graph both linear and nonlinear functions by creating tables and plotting points.
Virginia Department of Education
Graphing Linear Equations
Combine linear equations and a little creativity to produce a work of art. Math scholars create a design as they graph a list of linear equations. Their project results in a stained glass window pattern that they color.
Curated OER
Halloween Point Plot
Practice graphing and plotting points with a festive Halloween flair! Scholars plot 21 points on a grid, connecting them to create a spooky shape!
Math Worksheets Land
Halloween Cartesian Art: Bat
Get the class batty over graphing. Young mathematicians plot ordered pairs in all quadrants of a Cartesian plane, and connect the points to create a bat.
Math Drills
Halloween Cartesian Art: Witch Hat
What is the mystery picture? After plotting points on the first quadrant of a Cartesian coordinate system, young mathematicians connect the points to create a Halloween-themed picture.
Curated OER
Graphing Linear Equations
In this graphing linear equations worksheet, students plot 22 lines on their coordinate grids. When directions are followed carefully, the result is a picture.
Balanced Assessment
Cost of Living
Math scholars investigate the cost of living in Hong Kong compared to Chicago but must first convert the different types of currency. They then choose a type of graph to compare different spending categories and finish the activity by...
Curated OER
Graph a Picture on Cartesian Coordinates
Find out what picture is hidden in this graph and work on coordinate graphing with this worksheet! Learners plot 66 ordered pair points on a Cartesian graph, then connect the dots to make a picture. This would work as an in-class...
Inside Mathematics
Population
Population density, it is not all that it is plotted to be. Pupils analyze a scatter plot of population versus area for some of the states in the US. The class members respond to eight questions about the graph, specific points and...
Inside Mathematics
Snakes
Get a line on the snakes. The assessment task requires the class to determine the species of unknown snakes based upon collected data. Individuals analyze two scatter plots and determine the most likely species for five additional data...
Math Drills
Christmas Cartesian Art Santa
Santa has his eye on you in a graphing activity that has young mathematicians plot ordered pairs on a Cartesian plane. After joining the points together, a picture of jolly Santa Claus comes to life.
Math Drills
Christmas Cartesian Art Tree
Spruce up graphing practice with an activity that has young mathematicians plot points on a coordinate plane, and then connect the points to create a Christmas tree.
Curated OER
The Cartesian Plane
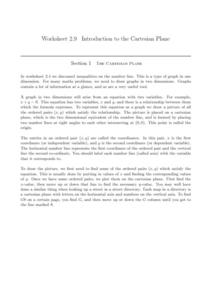
Learners solve and complete 22 various types of problems. First, they find the gradients of the lines and plot the given points. Then, they complete the table of values for each equation and use the table to draw the graph.
Math Drills
Christmas Cartesian Art Snowflake
A festive math worksheet hones graphic skills and keeps the season bright! Young mathematicians join points in the order they were graphed to create a snowflake picture.
Curated OER
You Can Get There From Here - Plotting on a Coordinate Plane
In this plotting worksheet, students plot given ordered pairs on a coordinate plane. After plotting each ordered pair, students connect line segments in consecutive order. Upon completion of the graphing exercise, students will have...
Curated OER
What's Brewing? Graphing On A Coordinate Plane
In this graphing worksheet, students graph given ordered pairs on a coordinate plane and connect the dots in consecutive order. Upon completion of the graphing exercise, students will have created a picture on the coordinate plane. They...
Virginia Department of Education
Road Trip
Help plan a road trip with linear equations. Scholars consider two different rental car companies and write equations representing the cost for each company. They graph the system of equations to determine the conditions under which each...
EduGAINs
Data Management
Using a carousel activity, class members gain an understanding of the idea of inferences by using pictures then connecting them to mathematics. Groups discuss their individual problems prior to sharing them with the entire class. The...
Curated OER
Boots
In this graphing practice learning exercise, 5th graders plot squares on a graph with an x and y axis. Once students locate each square they must color a certain design in that box to create a larger picture.
Curated OER
Graph Made Easy: Post Test
For this graphs worksheet, students answer multiple choice questions about line graphs and bar graphs. Students answer 10 questions total.


